Note
Go to the end to download the full example code.
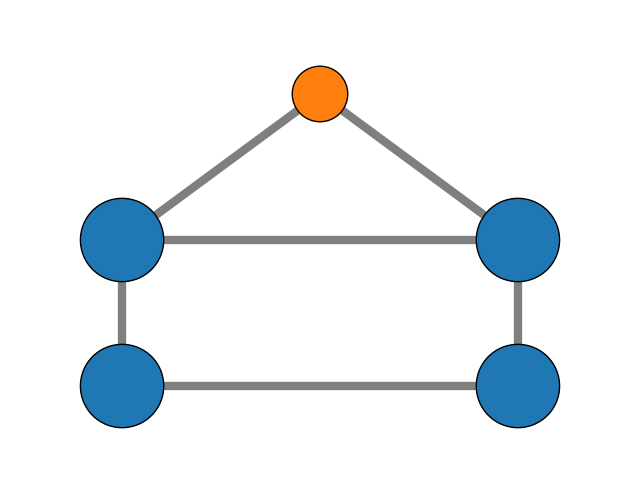
Plot a house#
This example from networkx shows how to integrate network attributes/data and plotting.
import networkx as nx
import matplotlib.pyplot as plt
import iplotx as ipx

G = nx.house_graph()
fig, ax = plt.subplots()
nx.set_node_attributes(G, {0: (0, 0), 1: (1, 0), 2: (0, 1), 3: (1, 1), 4: (0.5, 2.0)}, "pos")
nx.set_node_attributes(
    G,
    {
        n: {
            "size": 60 if n != 4 else 40,
            "color": "tab:blue" if n != 4 else "tab:orange",
        }
        for n in G.nodes()
    },
)
ipx.plot(
    G,
    ax=ax,
    layout="pos",
    style={
        "edge": {
            "alpha": 0.5,
            "linewidth": 6,
        },
        # You could use "vertex" instead of "node"
        "node": {
            "size": G.nodes.data("size"),
            "facecolor": G.nodes.data("color"),
            "edgecolor": "k",
        },
    },
)
ax.margins(0.17)
plt.tight_layout()
Total running time of the script: (0 minutes 0.038 seconds)