Note
Go to the end to download the full example code.
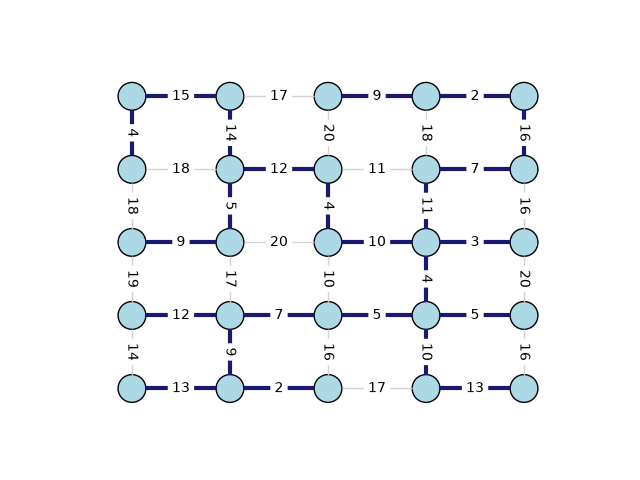
Minimum spanning trees#
This example from igraph shows how to work with edge labels and linewidths.
import random
import igraph as ig
import iplotx as ipx


random.seed(0)
g = ig.Graph.Lattice([5, 5], circular=False)
g.es["weight"] = [random.randint(1, 20) for _ in g.es]

mst_edges = g.spanning_tree(weights=g.es["weight"], return_tree=False)

g.es["color"] = "lightgray"
g.es[mst_edges]["color"] = "midnightblue"
g.es["width"] = 1.0
g.es[mst_edges]["width"] = 3.0

layout = g.layout("grid")

ipx.network(
    g,
    layout=layout,
    edge_labels=g.es["weight"],
    style={
        "vertex": {
            "facecolor": "lightblue",
            "edgecolor": "black",
            "linewidth": 1,
        },
        "edge": {
            "linewidth": g.es["width"],
            "label": {
                "rotate": True,
                "bbox": {
                    "facecolor": "white",
                    "edgecolor": "none",
                },
            },
        },
    },
)

[<iplotx.network.NetworkArtist object at 0x7af390195950>]
If you want to avoid rotating the labels vertically and let them follow the edge directions instead, just set the “rotate” parameter to False (or skip it in the default style):
ipx.network(
    g,
    layout=layout,
    edge_labels=g.es["weight"],
    style={
        "vertex": {
            "facecolor": "lightblue",
            "edgecolor": "black",
            "linewidth": 1,
        },
        "edge": {
            "linewidth": g.es["width"],
            "label": {
                "rotate": False,
                "bbox": {
                    "facecolor": "white",
                    "edgecolor": "none",
                },
            },
        },
    },
)
[<iplotx.network.NetworkArtist object at 0x7af390195310>]
Total running time of the script: (0 minutes 0.193 seconds)