Note
Go to the end to download the full example code.
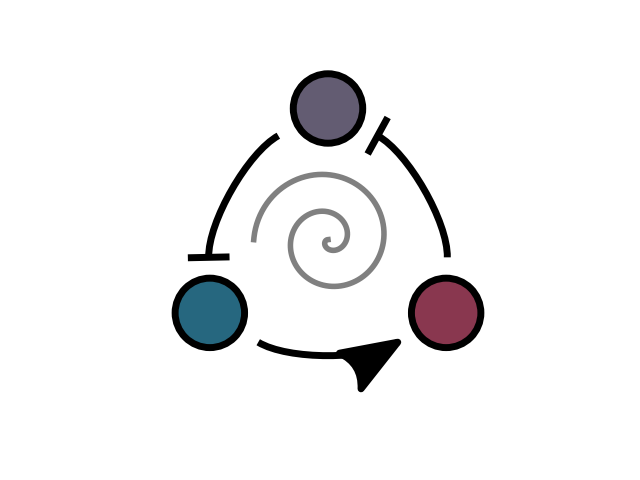
Feedback loops#
Graphs with arrows and bars are commonly used to represent feedback loops in systems.
This example shows how to obtain that effect in iplotx.
[<matplotlib.lines.Line2D object at 0x7af38fdb6350>]
import numpy as np
import matplotlib.pyplot as plt
import iplotx as ipx

graph = {
    "edges": [
        ("A", "B"),
        ("B", "C"),
        ("C", "A"),
    ],
    "directed": True,
}
layout = {
    "A": (0, 0),
    "B": (1, 0),
    "C": (0.5, 0.5 * 1.73),
}

fig, ax = plt.subplots()
ipx.network(
    graph,
    layout,
    ax=ax,
    vertex_size=50,
    edge_linewidth=5,
    edge_arrow_width=30,
    edge_arrow_height=40,
    edge_arrow_marker=[")>", "|", "|"],
    edge_shrink=15,
    edge_curved=True,
    edge_tension=[2, 2, 2],
    vertex_facecolor=["#26677FFF", "#635C72FF", "#89374FFF"],
    vertex_edgecolor="black",
    vertex_linewidth=5,
    aspect=1.0,
    margins=0.1,
)

# Add a parametric spiral
t = np.linspace(0, 4 * np.pi, 400)
ax.plot(
    0.5 + np.cos(t + np.pi) * t / 40,
    0.31 + np.sin(t + np.pi) * t / 40,
    color="grey",
    lw=4,
)
Total running time of the script: (0 minutes 0.034 seconds)