Note
Go to the end to download the full example code.
3D depth shading#
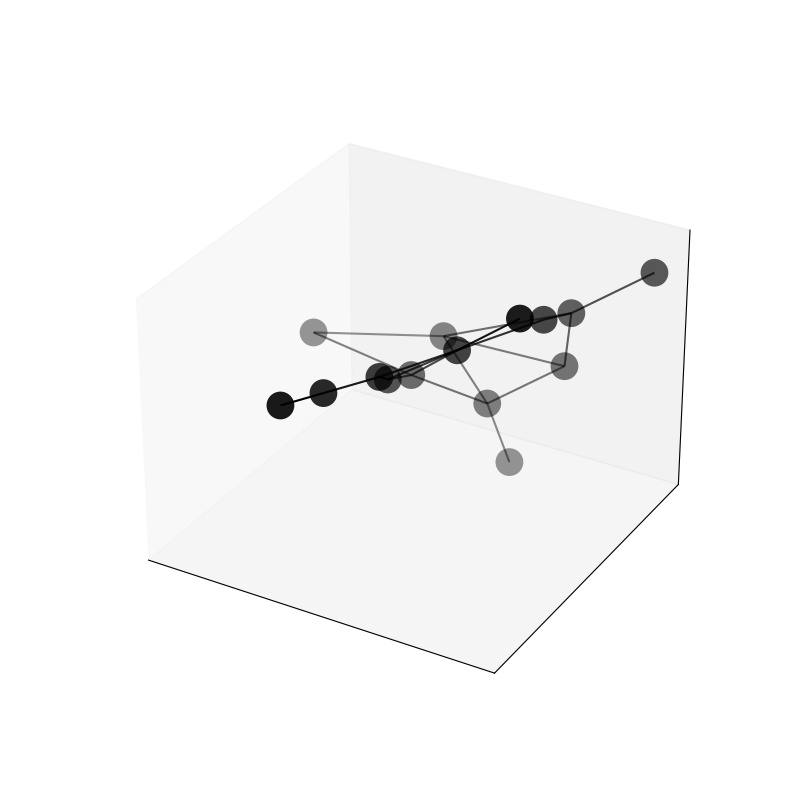
This example shows to to use depth shading in 3D plots to reduce the opacity (increase transparency) of vertices and edges that are further away from the viewer. This gives a better sense of depth but can be confusing in some cases, so there are style options to turn it off.
import igraph as ig
import iplotx as ipx

g = ig.Graph.Erdos_Renyi(15, m=20)

layout = g.layout_fruchterman_reingold_3d()

ipx.network(
    g,
    layout,
    vertex_alpha=0.9,
    figsize=(8, 8),
)
[<iplotx.network.NetworkArtist object at 0x7af3904ef750>]
Notice that depth shading is a 0-1 multiplier on top of the existing alpha value, so no vertex will have alpha (opacity) greater than 0.9 in this example, but vertices that are further back will have values below 0.9 (the minimum is usually 0.1).
Tip
To get a better sense of depth shading, use Matplotlib with an interactive backend and rotate the plot using the mouse.
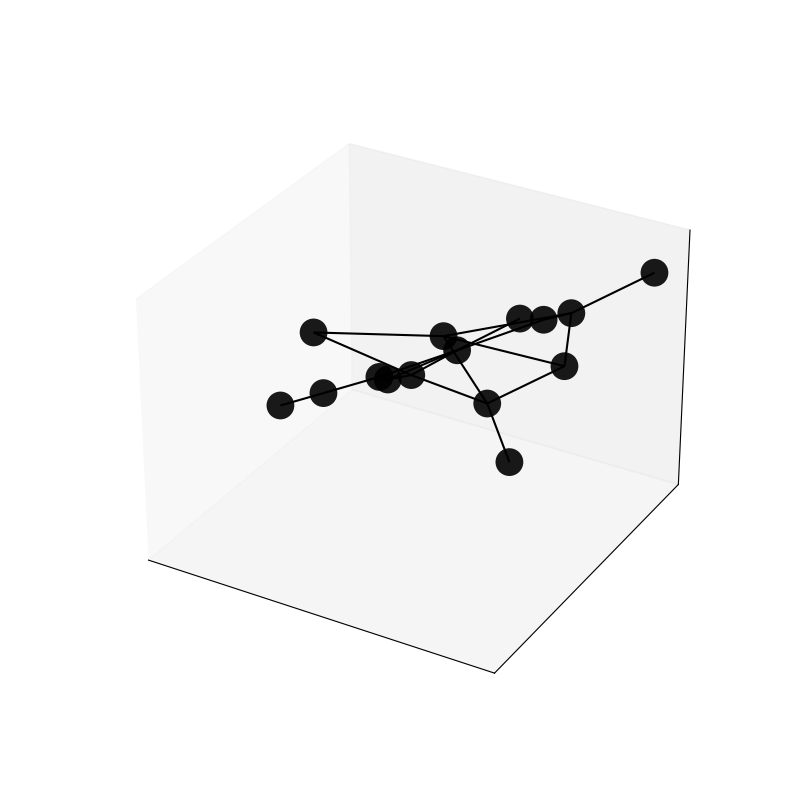
You can turn off depth shading by setting depthshade=False for vertices and/or edges:
ipx.network(
    g,
    layout,
    vertex_alpha=0.9,
    figsize=(8, 8),
    vertex_depthshade=False,
    edge_depthshade=False,
)
[<iplotx.network.NetworkArtist object at 0x7af3902f9810>]
In this case all vertices have the same opacity (0.9) regardless of their depth, and all edges have an opacity of 1.0 (no transparency).
Total running time of the script: (0 minutes 0.097 seconds)