Note
Go to the end to download the full example code.
Edge ports#
This example demonstrates how to use ports, which specify at which angle edges exit from and enter into vertices.
Port directions are single or double letters borrowed from geography: n (north or up), s (south or down), e (east or right), w (west or left). nw (north-west) and similar directions are also allowed.
Each edge has two ports, one for its exit from the source vertex, and one for its entry into the target vertex. For undirected graphs, these refer to the order in the graph data structure.
If only one port is needed, you can set the other one to None.
import igraph as ig
import matplotlib.pyplot as plt
import iplotx as ipx
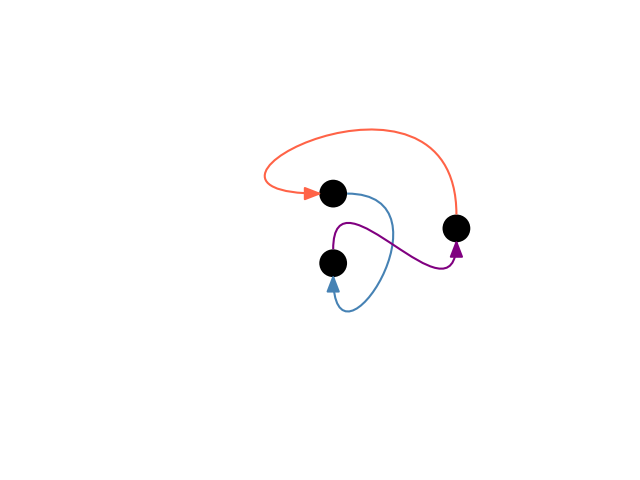
g = ig.Graph.Ring(3, directed=True)
ipx.network(
g,
layout="circle",
edge_curved=True,
edge_ports=[
("n", "w"), # exit from the top, enter from the left
("e", "s"), # exit from the right, enter from the bottom
("n", "s"), # exit from the top, enter from the bottom
],
edge_tension=[1.5, 1.8, 0.8],
edge_color=["tomato", "steelblue", "purple"],
)
[<iplotx.network.NetworkArtist object at 0x7af3906d5a90>]
Ports react to inversion of the x- or y-axis and set of axis limits from positive to negatives, e.g.:
fig, ax = plt.subplots()
ipx.network(
    g,
    ax=ax,
    layout="circle",
    edge_curved=True,
    edge_ports=[
        ("n", "w"),  # exit from the top, enter from the left
        ("e", "s"),  # exit from the right, enter from the bottom
        ("n", "s"),  # exit from the top, enter from the bottom
    ],
    edge_tension=[1.5, 1.8, 0.8],
    edge_color=["tomato", "steelblue", "purple"],
)
ax.invert_xaxis()
ax.invert_yaxis()
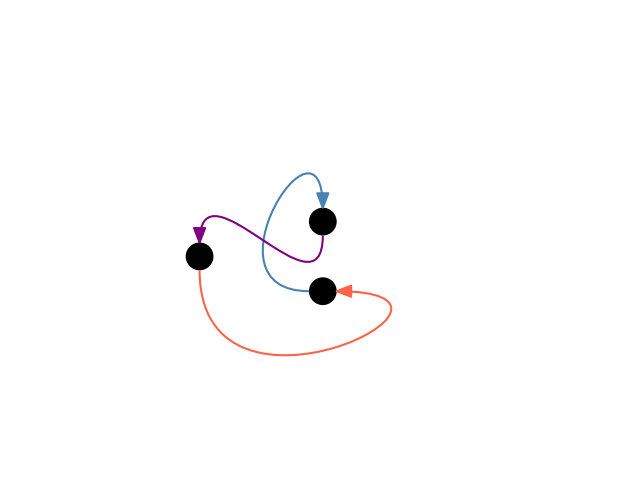
is the mirror image (in both x and y) of the previous plot. Here’s the same example but setting some ports to None:
g = ig.Graph.Ring(3, directed=True)

ipx.network(
    g,
    layout="circle",
    edge_curved=True,
    edge_ports=[
        (None, "w"),
        ("e", "s"),
        ("n", None),
    ],
    edge_tension=[1.0, 1.8, 0.5],
)
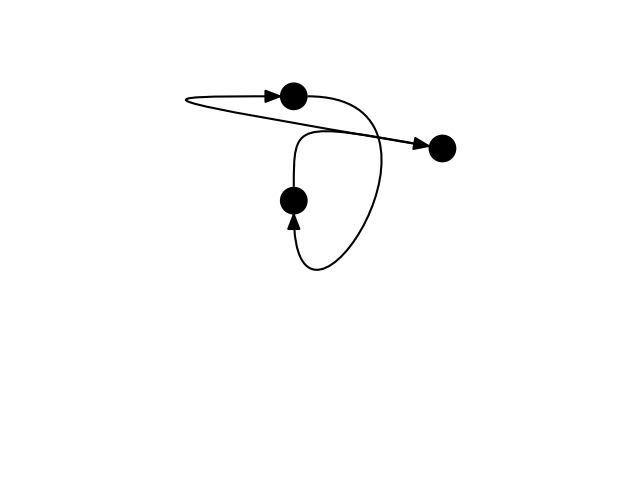
[<iplotx.network.NetworkArtist object at 0x7af390c27d90>]
Total running time of the script: (0 minutes 0.087 seconds)