Note
Go to the end to download the full example code.
Basics of styling#
This example shows a few simple styling options available in iplotx.
Tip
iplotx has an internal library of styles. See the Style library example.
import igraph as ig
import matplotlib.pyplot as plt
import iplotx as ipx
g = ig.Graph.Ring(5)
layout = g.layout("circle")
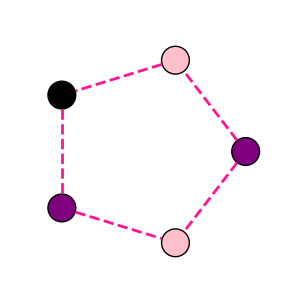
style = {
"vertex": {
"facecolor": ["purple", "pink", "black"],
"edgecolor": "black",
},
"edge": {
"linestyle": "--",
"linewidth": 2,
"color": "deeppink",
},
}
fig, ax = plt.subplots(figsize=(3, 3))
ipx.network(g, ax=ax, layout=layout, style=style)
[<iplotx.network.NetworkArtist object at 0x7af3902f9bd0>]
You can also chain styles. For example, you can apply an existing style first, and then modify it with a custom dictionary:
style = {
    "edge": {
        "linestyle": "--",
    },
}
fig, ax = plt.subplots(figsize=(3, 3))
ipx.network(
    g,
    ax=ax,
    layout=layout,
    style=["rededge", style],
)
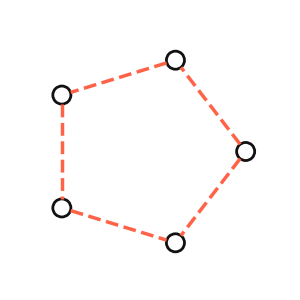
[<iplotx.network.NetworkArtist object at 0x7af3904eca50>]
As you can see, the network is visualised with the “rededge” style (which has red, solid edges) but further modified to have dashed lines.
Total running time of the script: (0 minutes 0.049 seconds)