Note
Go to the end to download the full example code.
Biopython tree#
This example shows how to use iplotx to plot trees from Biopython’s Phylo module.
from Bio import Phylo
from io import StringIO
import matplotlib.pyplot as plt
import iplotx as ipx

# Make a tree from a string in Newick format
tree = next(
    Phylo.NewickIO.parse(
        StringIO(
            "(()(()((()())(()()))))",
        )
    )
)

ipx.plotting.tree(
    tree,
)
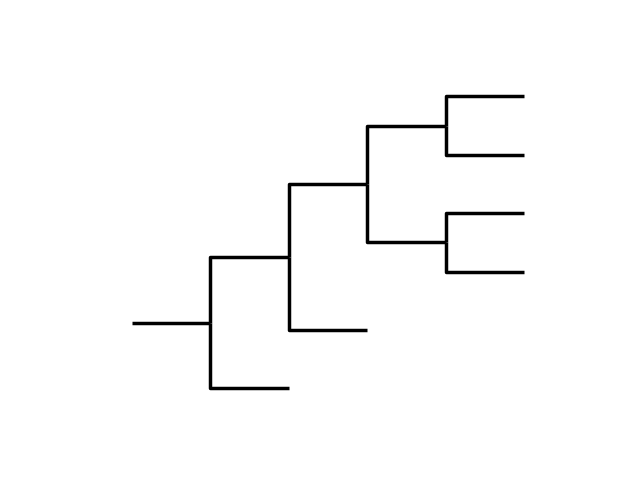
<iplotx.tree.TreeArtist object at 0x7af382c1f610>
To add labels to the leaves, you can use the leaf_labels argument as a dictionary. Moreover, the plot can be customised further using hmargin (horizontal label margin) and some matplotlib settings.
# sphinx_gallery_thumbnail_number = 2
leaf_labels = {leaf: f"Species {i + 1}" for i, leaf in enumerate(tree.get_terminals())}
fig, ax = plt.subplots(figsize=(4, 4))
ipx.plotting.tree(
    tree,
    ax=ax,
    leaf_labels=leaf_labels,
    leaf_label_hmargin=10,
    leaf_deep=False,
)
ax.set_xlim(0, 8)
ax.invert_yaxis()

iplotx can compute a radial tree layout as well, and usual style modifications work for trees same as networks:
ipx.plotting.tree(
    tree,
    layout="radial",
    style=[
        "tree",
        {
            "edge": {
                "color": ["black", "pink"],
                "linewidth": 4,
            },
        },
    ],
    aspect=1,
    title="Black pink in your area",
)
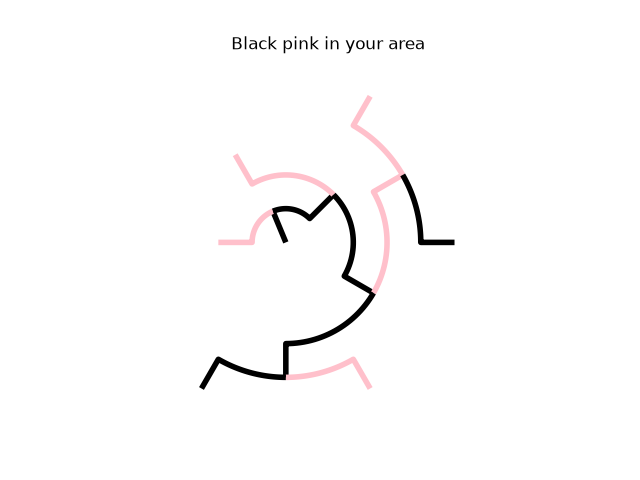
<iplotx.tree.TreeArtist object at 0x7af382c30e10>
Total running time of the script: (0 minutes 0.109 seconds)