Note
Go to the end to download the full example code.
Arcs#
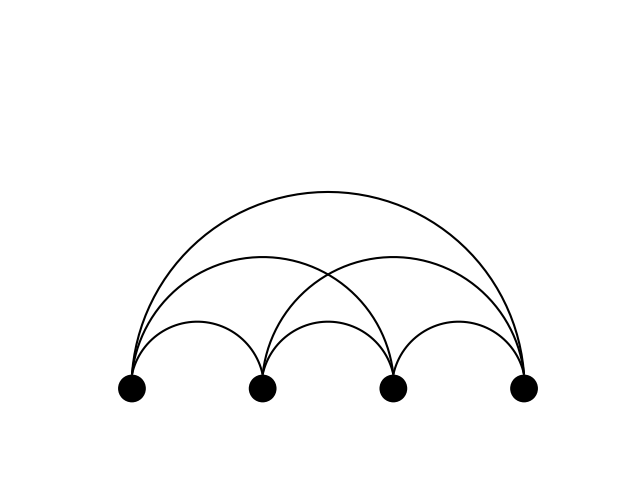
This example showcases the ability of iplotx to curve edges into arcs, using tension to define the angular span of the arc.
import igraph as ig
import matplotlib.pyplot as plt
import iplotx as ipx


g = ig.Graph.Full(4)
layout = [[0, 0], [1, 0], [2, 0], [3, 0]]

fig, ax = plt.subplots()
ipx.plot(
    g,
    layout=layout,
    ax=ax,
    edge_arc=True,
    edge_tension=-1,
)
[<iplotx.network.NetworkArtist object at 0x7af3e8d87250>]
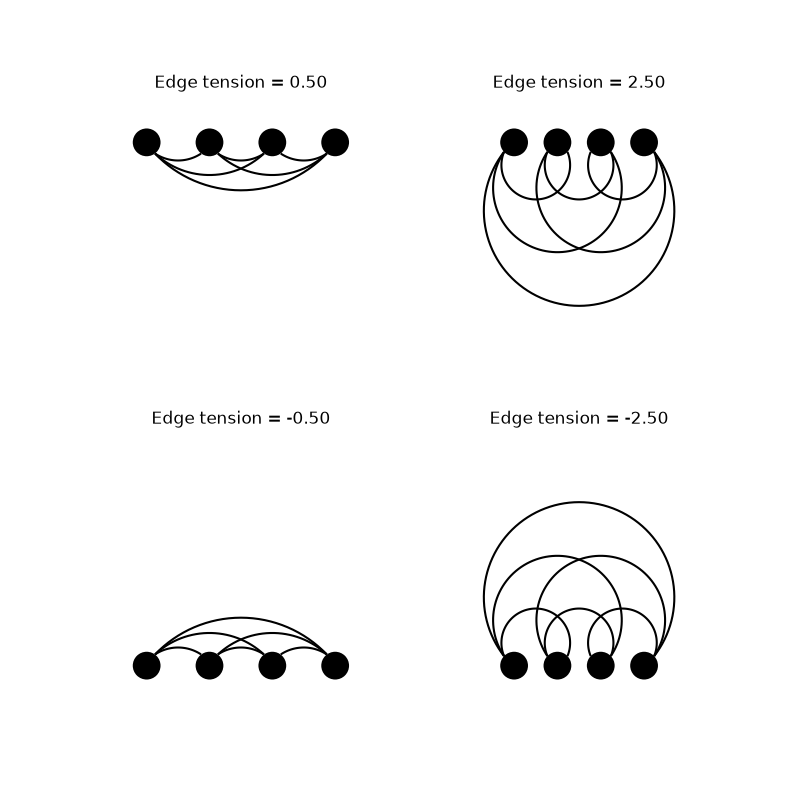
Other values of tension can be used to create different arc shapes:
fig, axs = plt.subplots(2, 2, figsize=(8, 8))
for tension, ax in zip([0.5, 2.5, -0.5, -2.5], axs.ravel()):
    ipx.plot(
        g,
        layout=layout,
        ax=ax,
        edge_arc=True,
        edge_tension=tension,
        margins=0.15,
        title=f"Edge tension = {tension:.2f}",
    )
Tip
Tension is defined as the tangent of the quarter of the angle spanned by the arc. A tension of 0 gives a straight line, a tension of 1 gives a semicircle, and higher tensions give increasingly larger arcs. A tension of infinity would give you a straight line away from the target vertex, but is not accepted by the library. Negative tensions result in arcs curving in the opposite direction.
Total running time of the script: (0 minutes 0.169 seconds)