Note
Go to the end to download the full example code.
Pollinators#
This example demonstrates how to visualise the bipartite relationship between plants and their pollinators using iplotx.
This particular example uses igraph to load and process the network data, but you can also use networkx, the internal
data structures of iplotx, or any other library you prefer.
import igraph as ig
import pandas as pd
import matplotlib.pyplot as plt
import iplotx as ipx
# Load the data with the adjacency matrix. 1 means that pollinator j visits plant i.
edge_data = pd.read_csv("https://dshizuka.github.io/networkanalysis/SampleData/Sample_bipartite.csv", index_col=0)
# Convert it into a DataFrame for igraph
edge_data = edge_data.T.stack()
edge_data = edge_data[edge_data > 0].index.to_frame()
edge_data.columns = ["from", "to"]
g = ig.Graph.DataFrame(edge_data, directed=True, use_vids=False)
# Set vertex types: plants (0) and pollinators (1)
g.vs["type"] = [0 if name.startswith("Plant") else 1 for name in g.vs["name"]]
# Compute bipartite layout
layout = g.layout_bipartite()
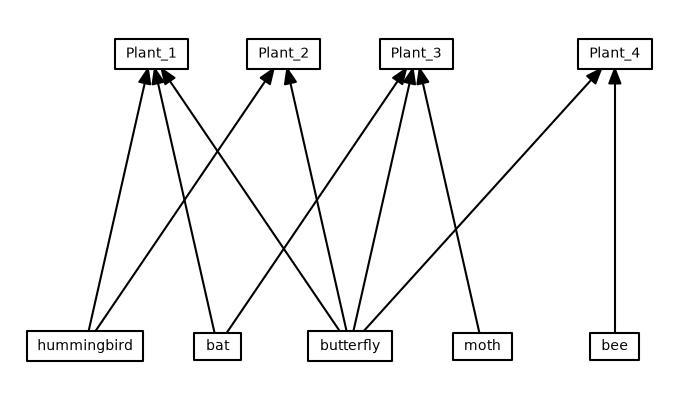
fig, ax = plt.subplots(figsize=(7, 4))
ipx.network(
g,
layout=layout,
style="hollow",
ax=ax,
vertex_labels=g.vs["name"],
)
fig.tight_layout()
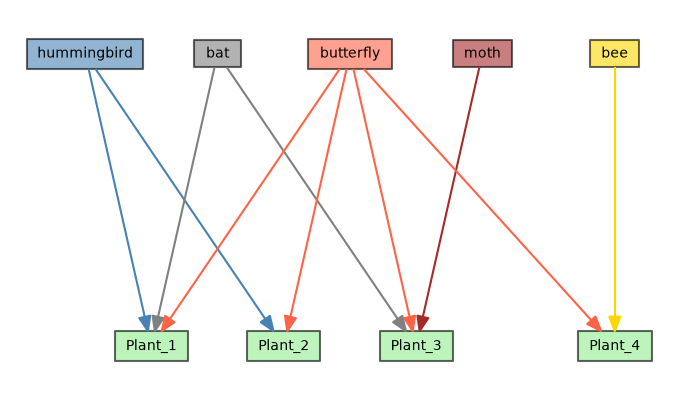
We can add a bit of color and invert the y axis direction for clarity:
color_map = {"hummingbird": "steelblue", "bat": "grey", "butterfly": "tomato", "moth": "brown", "bee": "gold"}
vertex_facecolors = {}
for i, name in enumerate(g.vs["name"]):
    vertex_facecolors[i] = color_map.get(name, "lightgreen")

edge_colors = []
for pollinator in edge_data["from"].values:
    edge_colors.append(color_map.get(pollinator, "lightgreen"))

# sphinx_gallery_thumbnail_number = 2
fig, ax = plt.subplots(figsize=(7, 4))
ipx.network(
    g,
    layout=layout,
    style="hollow",
    ax=ax,
    vertex_labels=g.vs["name"],
    vertex_facecolor=vertex_facecolors,
    vertex_alpha=0.6,
    edge_color=edge_colors,
)
ax.invert_yaxis()
fig.tight_layout()
Total running time of the script: (0 minutes 0.200 seconds)