Note
Go to the end to download the full example code.
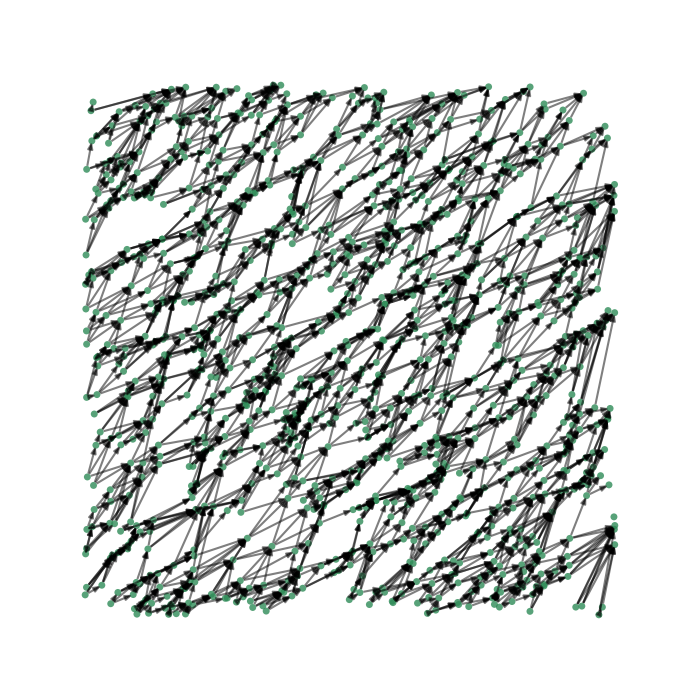
Arrow lawn#
This example demonstrates the visualisation of a network with 1,000 nodes and a few thousand edges, using a custom layout that resembles a lawn of arrows.
import numpy as np
import iplotx as ipx
import matplotlib.pyplot as plt

n = 1000  # Number of nodes
k = 3
layout = np.random.rand(n, 2)
nodes = np.arange(n)
edges = []
for i, v1 in enumerate(layout):
    found = 0
    dv = layout - v1
    for j in (dv**2).sum(axis=1).argsort()[1:]:
        angle = 180 / np.pi * np.arctan2(dv[j, 1], dv[j, 0])
        # Only make an edge for neighbors towards the north-east
        if 10 < angle < 80:
            edges.append((i, j))
            found += 1
            if found == k:
                break

# Plot the network using iplotx
fig, ax = plt.subplots(figsize=(7, 7))
ipx.network(
    {'nodes': nodes, 'edges': edges, 'directed': True},
    layout=layout,
    ax=ax,
    vertex_size=5,
    vertex_alpha=0.8,
    vertex_facecolor="seagreen",
    vertex_edgecolor="none",
    edge_arrow_width=3,
    edge_alpha=0.5,
)
fig.tight_layout()
If you want to start pushing the scalability of iplotx, you can try with 10,000 nodes and
~30,000 edges. This takes ~14 seconds on a modern laptop, of which 5 are spent on building
the network and 9 are spent inside of iplotx visualising it:
n = 10000  # Number of nodes
k = 3
layout = np.random.rand(n, 2)
nodes = np.arange(n)
edges = []
for i, v1 in enumerate(layout):
    found = 0
    dv = layout - v1
    for j in (dv**2).sum(axis=1).argsort()[1:]:
        angle = 180 / np.pi * np.arctan2(dv[j, 1], dv[j, 0])
        # Only make an edge for neighbors towards the north-east
        if 10 < angle < 80:
            edges.append((i, j))
            found += 1
            if found == k:
                break

# Plot the network using iplotx
fig, ax = plt.subplots(figsize=(9, 9))
ipx.network(
    {'nodes': nodes, 'edges': edges, 'directed': True},
    layout=layout,
    ax=ax,
    vertex_size=5,
    vertex_alpha=0.8,
    vertex_facecolor="seagreen",
    vertex_edgecolor="none",
    edge_arrow_width=3,
    edge_alpha=0.5,
)
fig.tight_layout()

Total running time of the script: (0 minutes 49.714 seconds)