Note
Go to the end to download the full example code.
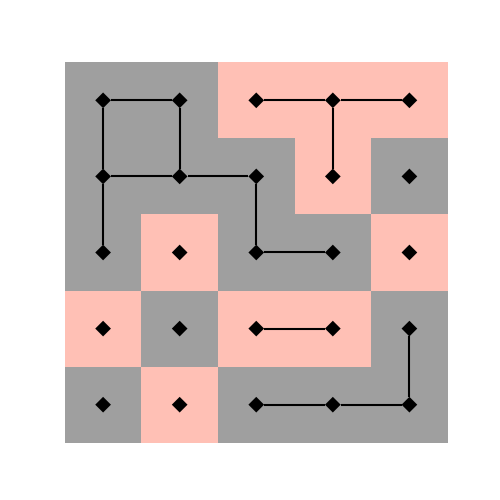
The red and the black#
This example demonstrates how to overlay an iplotx artist with plain matplotlib patches.
import numpy as np
import iplotx as ipx
import matplotlib.pyplot as plt

# We will use a network laid out onto a square grid
gsize = 5  # Grid size
layout = [(i % gsize, i // gsize) for i in range(gsize**2)]

# Two possible colors
colorlist = np.array(["tomato", "#111"])

# Assign node colors at random
node_colors = colorlist[np.random.randint(2, size=gsize**2)]

# Connect two neighboring nodes if they have the same color
edges = []
for inode in range(gsize**2):
    i = inode // gsize
    j = inode % gsize
    # Four possible edges
    cands = []
    if i != 0:
        cands.append(inode - gsize)
    if j != 0:
        cands.append(inode - 1)
    if i != gsize - 1:
        cands.append(inode + gsize)
    if j != gsize - 1:
        cands.append(inode + 1)
    for inode2 in cands:
        if node_colors[inode] == node_colors[inode2]:
            if (inode2, inode) not in edges:
                edges.append((inode, inode2))

# Build the network using our zero-dependency data structure
network = {
    "edges": edges,
    "nodes": list(range(gsize**2)),
}

# Visualise the network
fig, ax = plt.subplots(figsize=(5, 5))
ipx.network(
    network,
    layout=layout,
    ax=ax,
    vertex_size=8,
    vertex_marker='d',
)

# Add square patches centered on each node
for i in range(gsize):
    for j in range(gsize):
        inode = i * gsize + j
        ax.add_patch(plt.Rectangle(
            (j-0.5, i-0.5),
            1,
            1,
            facecolor=node_colors[inode],
            edgecolor="none",
            alpha=0.4,
            zorder=0,
        ))
Total running time of the script: (0 minutes 0.044 seconds)