Note
Go to the end to download the full example code.
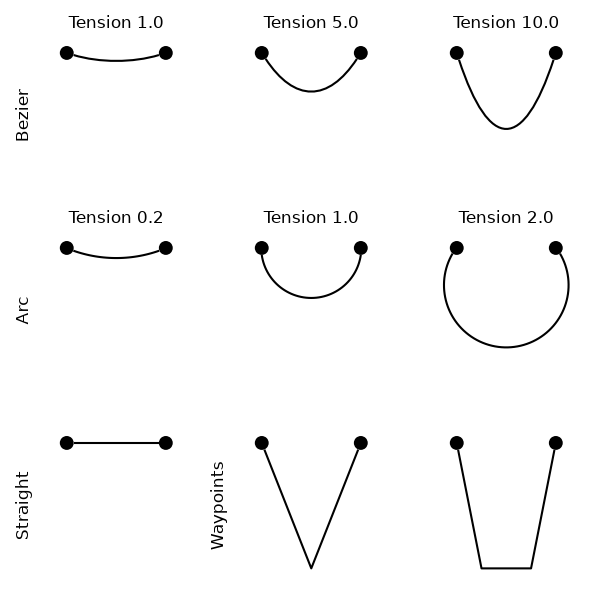
Edge geometries#
This example shows how to use edge geometries and tension to achieve different visualisation styles.
import igraph as ig
import matplotlib.pyplot as plt
import iplotx as ipx


g = ig.Graph.Full(2)
layout = [[0, 0], [1, 0]]

fig, axs = plt.subplots(3, 3, figsize=(6, 6), sharex=True, sharey=True)
tensions = [
    [1, 5, 10],
    [0.2, 1, 2],
]
for edge_arc, axrow, tensionrow in zip([False, True], axs, tensions):
    kwargs = {}
    if not edge_arc:
        kwargs["edge_curved"] = True
    for tension, ax in zip(tensionrow, axrow):
        ipx.plot(
            g,
            layout=layout,
            ax=ax,
            edge_arc=edge_arc,
            edge_tension=tension,
            title=f"Tension {tension:.1f}",
            node_size=10,
            **kwargs,
        )
axs[0, 0].set_ylabel("Bezier", fontsize=12)
axs[1, 0].set_ylabel("Arc", fontsize=12)
ipx.plot(
    g,
    layout,
    ax=axs[2, 0],
    node_size=10,
)
axs[2, 0].set_ylabel("Straight", fontsize=12)
ipx.plot(
    g,
    layout,
    ax=axs[2, 1],
    node_size=10,
    edge_waypoints=[[0.5, -0.15]],
)
ipx.plot(
    g,
    layout,
    ax=axs[2, 2],
    node_size=10,
    edge_waypoints=[[[0.25, -0.15], [0.75, -0.15]]],
)
axs[2, 1].set_ylabel("Waypoints", fontsize=12)
fig.tight_layout()
Total running time of the script: (0 minutes 0.214 seconds)