Note
Go to the end to download the full example code.
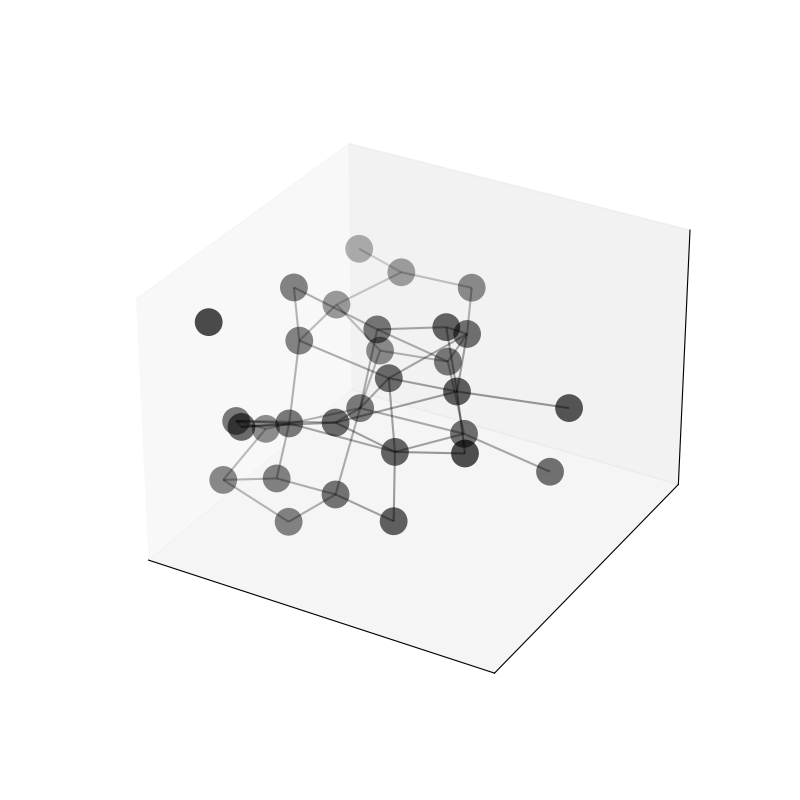
3D layouts#
This example shows how to visualise graphs or networks in 3D using iplotx. Of course, a 3D layout is needed
for this. Here, we use the Fruchterman-Reingold layout algorithm from igraph to generate a 3D layout.
Note
3D visualisation is most useful when used interactively, so you can rotate and pan the plot to inspect it from different angles. Matplotlib supports this both in Jupyter notebooks and in IPython via multiple interactive backends (e.g., TkAgg, Qt5Agg, etc.). These plots can also be saved as static images (the ones you see below were generated this way), however these static images can be quite difficult to interpret.
import igraph as ig
import iplotx as ipx

# Make the graph
g = ig.Graph.Erdos_Renyi(30, m=50)

# Make a 3D layout
layout = g.layout_fruchterman_reingold_3d()

# Visualise the graph in 3D
ipx.network(
    g,
    layout,
    vertex_alpha=0.7,
    edge_alpha=0.4,
    figsize=(8, 8),
)
[<iplotx.network.NetworkArtist object at 0x7dd1fa2b0e10>]
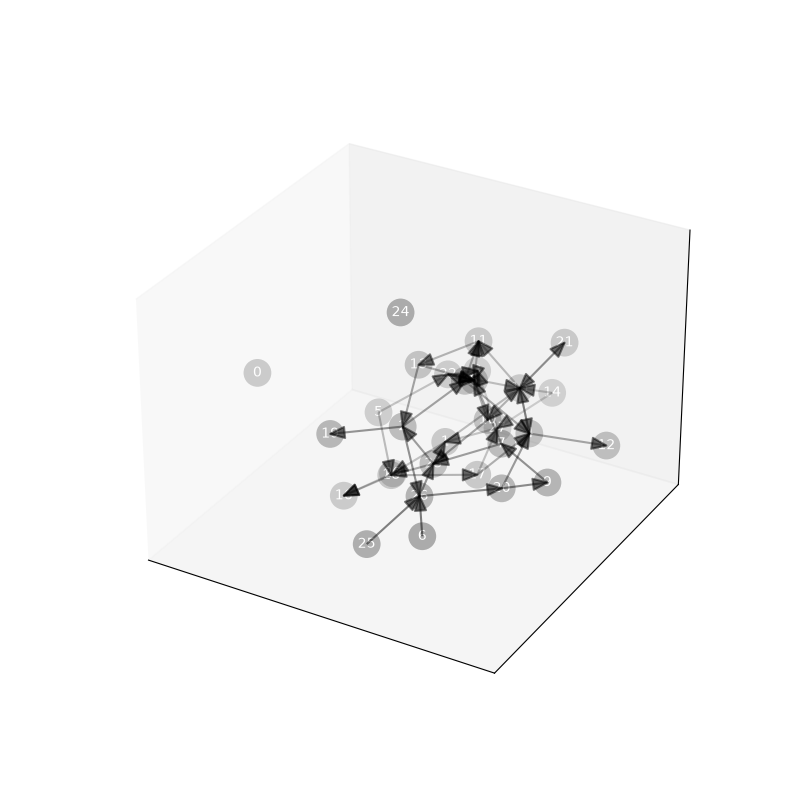
Below is a variation using arrows and vertex labels:
import igraph as ig
import iplotx as ipx

# Make the graph
g = ig.Graph.Erdos_Renyi(30, m=50, directed=True)

# Make a 3D layout
layout = g.layout_fruchterman_reingold_3d()

# Visualise the graph in 3D
ipx.network(
    g,
    layout,
    vertex_alpha=0.3,
    edge_alpha=0.5,
    vertex_labels=True,
    figsize=(8, 8),
)
[<iplotx.network.NetworkArtist object at 0x7dd20112f890>]
Warning
3D visualisation does not support all features of 2D visualisation yet. Curved edges, waypoints, and edge labels are currently unsupported. PRs are welcome!
Total running time of the script: (0 minutes 0.166 seconds)