Installing#
pip install iplotx
To also install ilayoutx to compute network layouts before visualising them:
pip install iplotx ilayoutx
Quick Start#
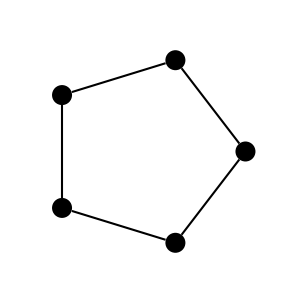
import igraph as ig
import iplotx as ipx

g = ig.Graph.Ring(5)
layout = g.layout("circle").coords
ipx.network(g, layout)
import networkx as nx
import iplotx as ipx

g = nx.Graph([(0, 1), (1, 2), (2, 3), (3, 4), (4, 0)])
layout = nx.layout.circular_layout(g)
ipx.network(g, layout)
Either way, the result is the same:
Features#
iplotx’s features’ include:
per-edge and per-vertex styling using sequences or dictionaries
labels
arrows
tunable offset for parallel (i.e. multi-) edges
ports (a la Graphviz)
curved edges and self-loops with controllable tension
tree layouts
label-based vertex autoscaling
node label margins and padding
export to many formats (e.g. PNG, SVG, PDF, EPS) thanks to
matplotlibcompatibility with many GUI frameworks (e.g. Qt, GTK, Tkinter) thanks to
matplotlibdata-driven axes autoscaling
consistent behaviour upon zooming and panning
correct HiDPI scaling (e.g. retina screens) including for vertex sizes, arrow sizes, and edge offsets
a consistent
matplotlibartist hierarchypost-plot editability (e.g. for animations)
interoperability with other charting tools (e.g.
seaborn)chainable style contexts
vertex clusterings and covers with convex hulls and rounding
a plugin mechanism for additional libraries
animations (see Animations)
3D visualisations
mouse/keyboard interaction and events (e.g. hover, click, see Mouse event handling)
… and many more.
Rationale#
We believe graph analysis, graph layouting, and graph visualisation to be three separate tasks. iplotx currently focuses on visualisation. It can also compute simple tree layouts and might expand towards network layouts in the future.
Citation#
If you use iplotx for publication figures, please cite:
F. Zanini. A universal tool for visualisation of networks and trees in Python. F1000Research 2025, 14:1377. https://doi.org/10.12688/f1000research.173131.1
Contributing#
Open an issue on GitHub to request features, report bugs, or show intention in contributing. Pull requests are very welcome.
Important
If you are the maintainer of a network/graph/tree analysis library and would like to propose improvements or see support for it, please reach out with an issue/PR on GitHub!
Local development#
To develop iplotx locally:
Clone the repository
Set up the code infrastructure using uv.
Install the
testdependency group:uv sync --group testRun the test suite with
.venv/bin/pytest.
Release new version (maintainers only)#
To release a new version:
Change version in
iplotx/version.pyusing semantic versioning (e.g.1.2.3).Commit and push changes to GitHub.
Wait to confirm all CI tests pass.
Create a new release on GitHub. The title must be
v1.2.3and the linked tag must be1.2.3. When you hit “publish”, a new GitHub action is triggered, which will release to PyPI. In case of discrepancies, the release title wins: a “v” is stripped from the title and the rest is pasted intoiplotx/version.pyif it’s a valid semantic version.