Note
Go to the end to download the full example code.
Grouping#
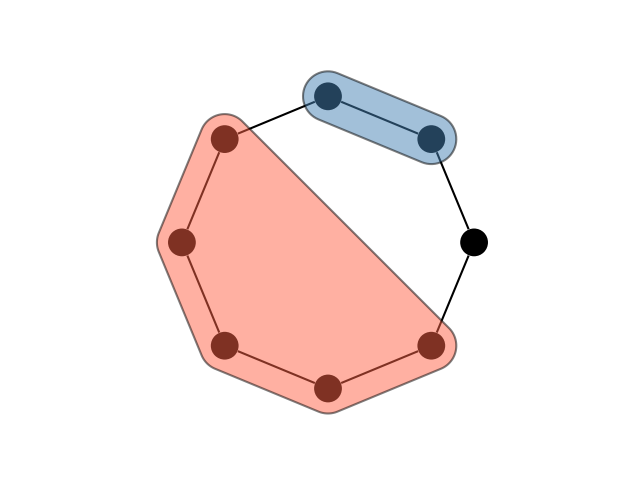
This example shows how to use the grouping argument to visualise vertex covers or clustering, including singletons (i.e. groups of one vertex).
The function takes a few different formats for the groups, but the easiest is a dictionary of sets, in which each key is the name of the group and each value is the set of vertices in that group.
import igraph as ig
import matplotlib.pyplot as plt
import iplotx as ipx

g = ig.Graph.Ring(8)

ipx.network(
    network=g,
    layout="circle",
    grouping={
        "singleton": {0},
        "doublet": {1, 2},
        "multiplet": {3, 4, 5, 6, 7},
    },
)
plt.gca().set_aspect(1.0)
Note
Group layouts are computed as rounded convex hulls around each group of vertices. If you are interested in contributing an algorithm that computes concave group layouts, please reach out on GitHub!
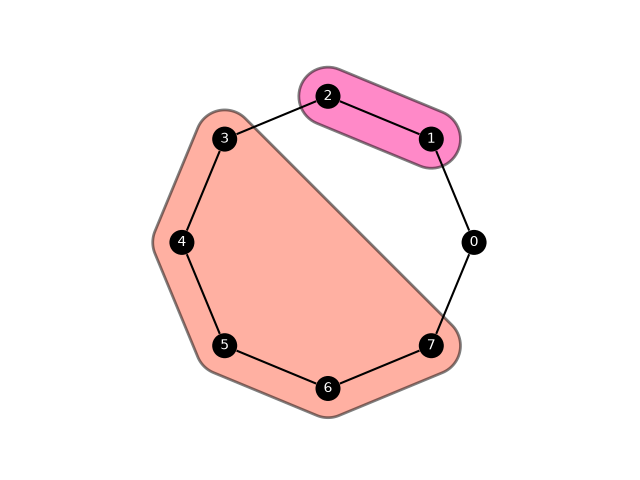
Groups can be styles in a similar way as all other elements in iplotx:
ipx.network(
    network=g,
    layout="circle",
    grouping={
        "singleton": {0},
        "doublet": {1, 2},
        "multiplet": {3, 4, 5, 6, 7},
    },
    vertex_size=18,
    vertex_labels=True,
    vertex_label_color="white",
    grouping_facecolor=["purple", "deeppink", "tomato"],
    grouping_edgecolor="black",
    grouping_linewidth=2,
    grouping_vertexpadding=21,
    network_zorder=2,
    grouping_zorder=1,
)
plt.gca().set_aspect(1.0)
Warning
vertexpadding and vertex_size are approximately the same units of measurements, but not exactly. If you need a tight padding, try reducing the padding value below the size of vertices until it’s as tight a fit as you need, as shown in the code below.
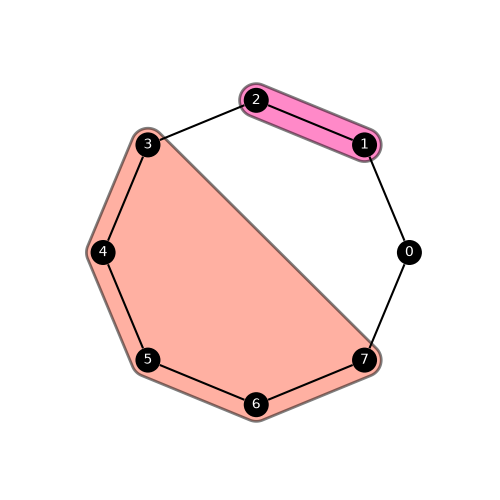
This can also be achieved with two separate calls, the first one to draw the network and the second to draw the grouping.
import igraph as ig
import matplotlib.pyplot as plt
import iplotx as ipx

g = ig.Graph.Ring(8)
layout = g.layout("circle")
fig, ax = plt.subplots(figsize=(5, 5))
ipx.network(
    network=g,
    layout=layout,
    ax=ax,
    vertex_size=18,
    vertex_labels=True,
    vertex_label_color="white",
    zorder=2,
)
ipx.network(
    grouping={
        "singleton": {0},
        "doublet": {1, 2},
        "multiplet": {3, 4, 5, 6, 7},
    },
    layout=layout,
    ax=ax,
    grouping_facecolor=["purple", "deeppink", "tomato"],
    grouping_edgecolor="black",
    grouping_linewidth=2,
    grouping_vertexpadding=12,  # Note the tighter padding
    zorder=1,
)
[<iplotx.network.groups.GroupingCollection object at 0x7dd1f9b17610>]
Note
The argument zorder is applied to both network and grouping style, however since only one of them is plotted each time this is equivalent to setting network_zorder and grouping_zorder. If both are specified, zorder takes priority over its more specific cousins.
Total running time of the script: (0 minutes 0.126 seconds)