Note
Go to the end to download the full example code.
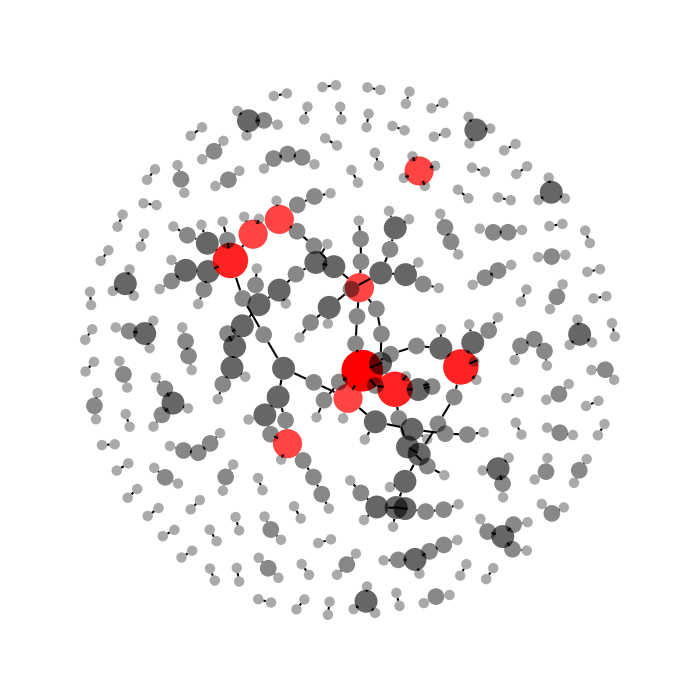
Protein Protein Interactions#
This example demonstrates how to visualise Protein Protein Interaction (PPI) networks using iplotx.
We use igraph to download the physical PPI network of E. coli from STRING database. The same thing could be done with networkx.
We also subsample the network to just 300 random interactions to keep it reasonably quick, but different filtering strategies are possible.
import igraph as ig
import numpy as np
import pandas as pd
import matplotlib.pyplot as plt
import iplotx as ipx


# Load the data with the adjacency matrix. 1 means that pollinator j visits plant i.
edge_data = pd.read_csv("https://stringdb-downloads.org/download/protein.physical.links.v12.0/511145.protein.physical.links.v12.0.txt.gz", sep=" ")
edge_data["weight"] = 1.0 * edge_data["combined_score"] / edge_data["combined_score"].max()

# Subset just to keep it quick as an example
edge_data = edge_data.sample(300, random_state=42)

# Convert it into a DataFrame for igraph
g = ig.Graph.DataFrame(edge_data, directed=False, use_vids=False)

# Compute layout
layout = g.layout_fruchterman_reingold()

# Highlight hubs
degrees = np.array(g.vs.degree()).astype(float)
vertex_size = 3 + 27 * degrees / degrees.max()
vertex_alpha = np.clip(0.2 + 0.8 * degrees / degrees.max(), 0, 1)
vertex_color = ["red" if d > degrees.max() / 2 else "black" for d in degrees]

# Visualise
fig, ax = plt.subplots(figsize=(7, 7))
ipx.network(
    g,
    layout=layout,
    ax=ax,
    vertex_size=vertex_size,
    vertex_alpha=vertex_alpha,
    vertex_facecolor=vertex_color,
)
fig.tight_layout()
Total running time of the script: (0 minutes 1.427 seconds)