Note
Go to the end to download the full example code.
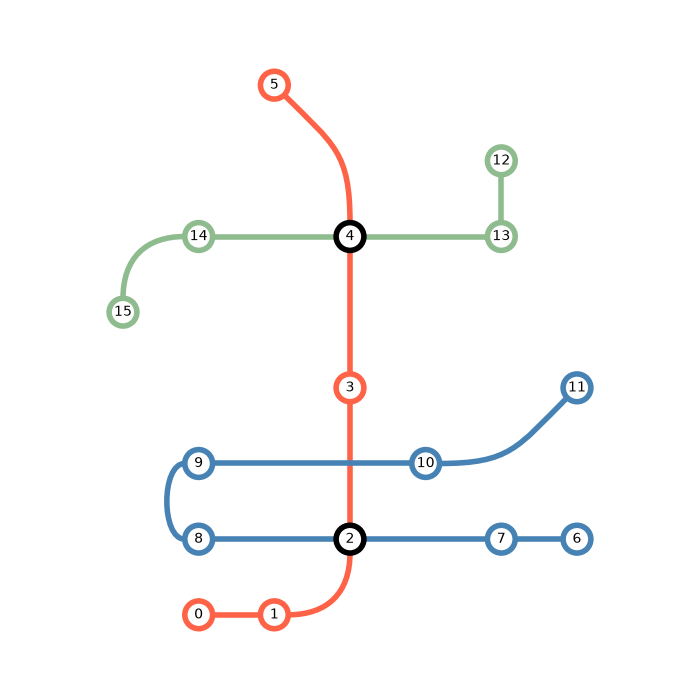
Train tracks#
This example demonstrates how to visualise train tracks using iplotx.
The layout, ports, edges, and colors are crafted by hand, as you would
expect for such a bespoke diagram.
import igraph as ig
import numpy as np
import pandas as pd
import matplotlib.pyplot as plt
import iplotx as ipx


edges = [
    (0, 1),
    (1, 2),
    (2, 3),
    (3, 4),
    (4, 5),
    (6, 7),
    (7, 2),
    (2, 8),
    (8, 9),
    (9, 10),
    (10, 11),
    (12, 13),
    (13, 4),
    (4, 14),
    (14, 15),
]

g = ig.Graph(edges, directed=False)

layout = np.array([
    [0, 0],
    [1, 0],
    [2, 1],
    [2, 3],
    [2, 5],
    [1, 7],
    [5, 1],
    [4, 1],
    [0, 1],
    [0, 2],
    [3, 2],
    [5, 3],
    [4, 6],
    [4, 5],
    [0, 5],
    [-1, 4],
], dtype=float)


# Use edge ports to control the train tracks placement between stations
ports_dict = {
    (1, 2): ("e", "s"),
    (4, 5): ("n", "se"),
    (8, 9): ("w", "w"),
    (10, 11): ("e", "sw"),
    (14, 15): ("w", "n"),
}
ports = [ports_dict.get(edge, None) for edge in edges]
tension = [0.5 * int(port is not None) for port in ports]

# Color stations and tracks by line
edge_color = ["tomato"] * 5 + ["steelblue"] * 6 + ["darkseagreen"] * 4
vertex_color = ["tomato"] * 6 + ["steelblue"] * 6 + ["darkseagreen"] * 4

# Hub stations are black
vertex_color[2] = "black"
vertex_color[4] = "black"

# Visualise
fig, ax = plt.subplots(figsize=(7, 7))
ipx.network(
    g,
    layout=layout,
    ax=ax,
    edge_ports=ports,
    edge_curved=True,
    edge_tension=tension,
    aspect="equal",
    vertex_labels=True,
    edge_linewidth=4,
    vertex_linewidth=4,
    vertex_facecolor="white",
    vertex_label_color="black",
    vertex_edgecolor=vertex_color,
    edge_color=edge_color,
    edge_capstyle="butt",
    vertex_zorder=3,
)
fig.tight_layout()
Total running time of the script: (0 minutes 0.067 seconds)