Note
Go to the end to download the full example code.
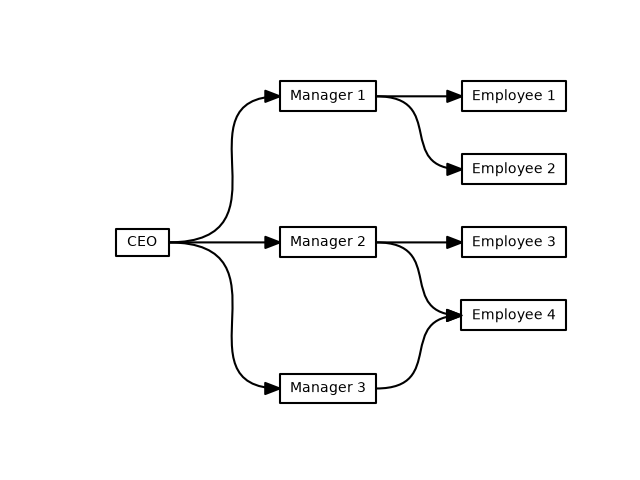
Company structure#
This example shows how to use iplotx to visualise simple logical relationships, for instance the organisational chart of a company.
import networkx as nx
import matplotlib.pyplot as plt
import iplotx as ipx

g = nx.DiGraph()
g.add_edges_from(
    [
        ("CEO", "Manager 1"),
        ("CEO", "Manager 2"),
        ("CEO", "Manager 3"),
        ("Manager 1", "Employee 1"),
        ("Manager 1", "Employee 2"),
        ("Manager 2", "Employee 3"),
        ("Manager 2", "Employee 4"),
        ("Manager 3", "Employee 4"),
    ]
)
layout = {
    "CEO": [0, 0],
    "Manager 1": [1, -1],
    "Manager 2": [1, 0],
    "Manager 3": [1, 1],
    "Employee 1": [2, -1],
    "Employee 2": [2, -0.5],
    "Employee 3": [2, 0],
    "Employee 4": [2, 0.5],
}
fig, ax = plt.subplots()
ipx.network(
    g,
    layout=layout,
    ax=ax,
    vertex_labels=True,
    style="hollow",
    vertex_marker="r",
    edge_ports=[("e", "w")] * 8,
    edge_curved=True,
    edge_tension=[0.65] * 3 + [0.6] * 5,
    margins=(0.08, 0.05),
)
# Show the layout top to bottom for clarity
ax.invert_yaxis()
If you prefer a more squared look, you can use S-style waypoints with per-edge offsets:
fig, ax = plt.subplots()
ipx.network(
    g,
    layout=layout,
    ax=ax,
    vertex_labels=True,
    style="hollow",
    vertex_marker="r",
    edge_ports=[("e", "w")] * 8,
    edge_waypoints="xmidy0,xmidy1",
    edge_offset=[(0, 0)] * 7 + [(0, -6)],
    margins=(0.08, 0.05),
    edge_linestyle=["-"] * 7 + ["--"],
)
ax.invert_yaxis()
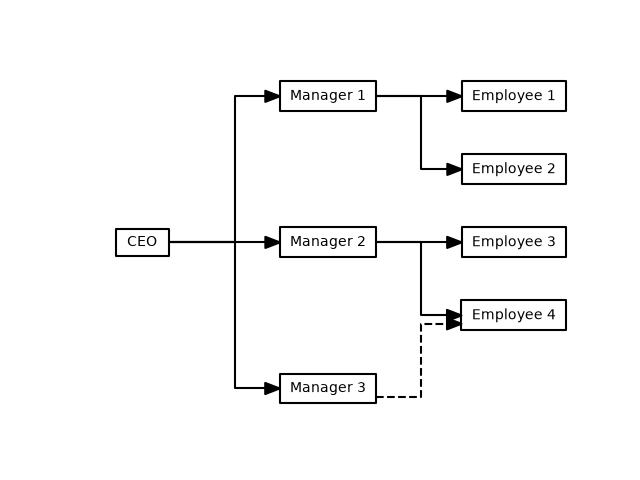
The offset edge style bypasses any layout coordinate system and acts in figure points directly. Combining edge offsets with noncartesian layout coordinate systems (e.g. polar) can lead to unexpected results.
Total running time of the script: (0 minutes 0.171 seconds)