Note
Go to the end to download the full example code.
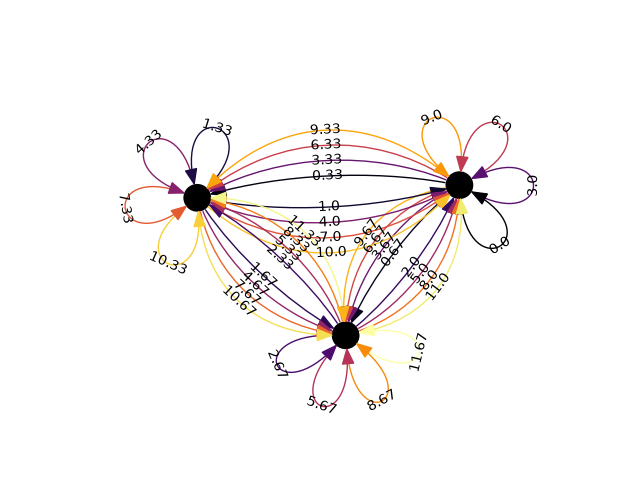
Complex example#
This example from networkx shows how to use complex network properties including edge tension.
import networkx as nx
import matplotlib as mpl
import matplotlib.pyplot as plt
import iplotx as ipx
import itertools as it

nodes = "ABC"
prod = list(it.product(nodes, repeat=2)) * 4
G = nx.MultiDiGraph()
for i, (u, v) in enumerate(prod):
    G.add_edge(u, v, w=round(i / 3, 2))
nx.set_node_attributes(G, nx.spring_layout(G, seed=3113794652), "pos")
csi = it.cycle([5 * r for r in it.accumulate([0.15] * 4)])
nx.set_edge_attributes(G, {e: next(csi) for e in G.edges(keys=True)}, "tension")
nx.set_edge_attributes(
    G,
    {tuple(e): w for *e, w in G.edges(keys=True, data="w")},
    "label",
)

fig, ax = plt.subplots()
ipx.plot(
    G,
    ax=ax,
    layout="pos",
    edge_labels=True,
    style={
        "edge": {
            "curved": True,
            "tension": G.edges.data("tension"),
            "color": G.edges.data("w"),
            "cmap": mpl.colormaps["inferno"],
            "linewidth": 1,
            "looptension": 7.5,
            "label": {
                "color": "black",
                "bbox": {
                    "facecolor": "none",
                },
            },
        },
    },
)
ax.margins(0.17)
Total running time of the script: (0 minutes 0.128 seconds)