Note
Go to the end to download the full example code.
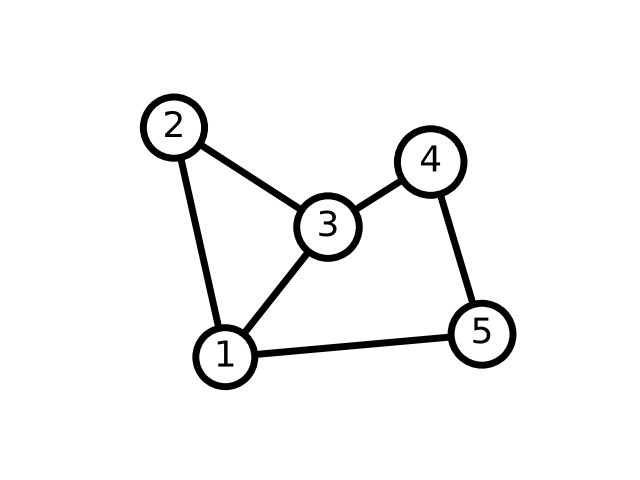
Simple example from networkx#
This example demonstrates how to use iplotx with networkx. Note how the vertex size is computed dynamically based on label size.
import networkx as nx
import matplotlib.pyplot as plt
import iplotx as ipx

G = nx.Graph()
G.add_edge(1, 2)
G.add_edge(1, 3)
G.add_edge(1, 5)
G.add_edge(2, 3)
G.add_edge(3, 4)
G.add_edge(4, 5)

# explicitly set positions
pos = {1: (0, 0), 2: (-1, 0.3), 3: (2, 0.17), 4: (4, 0.255), 5: (5, 0.03)}

ipx.network(
    G,
    layout=pos,
    vertex_labels=True,
    style={
        "vertex": {
            "size": "label",
            "facecolor": "white",
            "edgecolor": "black",
            "linewidth": 5,
            "label": {
                "size": 26,
                "color": "black",
            },
        },
        "edge": {
            "linewidth": 5,
        },
    },
)

# Set margins for the axes so that nodes aren't clipped
ax = plt.gca()
ax.margins(0.20)
Total running time of the script: (0 minutes 0.051 seconds)