Note
Go to the end to download the full example code.
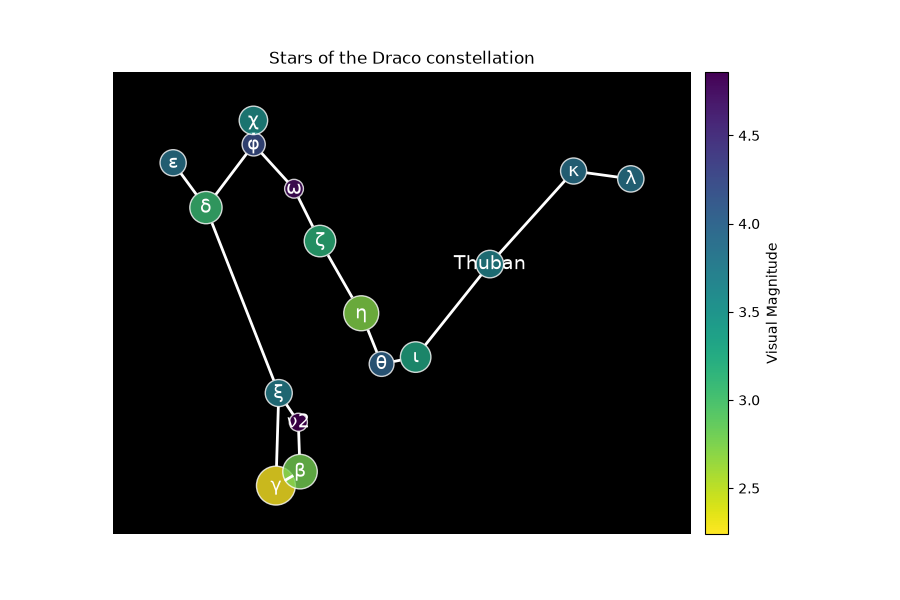
Constellation#
This example shows how to use iplotx to plot constellations. Data comes from Wikipedia: https://en.wikipedia.org/wiki/List_of_stars_in_Draco.
import matplotlib.pyplot as plt
import networkx as nx
import pandas as pd
import iplotx as ipx


def convert_ra(ra):
    """Convert right ascension from hours, minutes, seconds to degrees."""
    hours, minutes, seconds = ra.split()
    lon_deg = 15.0 * (int(hours.rstrip("h")) + int(minutes.rstrip("m")) / 60 + float(seconds.rstrip("s")) / 3600)
    return -lon_deg


def convert_dec(dec):
    """Convert declination from degrees, minutes, seconds to degrees."""
    deg, min, sec = dec.split()
    lat_deg = int(deg[:-1]) + int(min[:-1]) / 60 + float(sec[:-1]) / 3600
    return lat_deg


# Load star information
star_info = pd.read_csv(
    "data/draco_stars.csv",
    sep="\t",
)

# Limit to visible stars with a Bayer designation
star_info = star_info.dropna(subset="B").set_index("Name", drop=False)

# Compute angular coordinates in degrees
star_info["lon"] = star_info["RA"].apply(convert_ra)
star_info["lat"] = star_info["Dec"].apply(convert_dec)

g = nx.from_edgelist([
    ("γ Dra", "β Dra"),
    ("β Dra", "ν2 Dra"),
    ("ν2 Dra", "ξ Dra"),
    ("ξ Dra", "γ Dra"),
    ("ξ Dra", "δ Dra"),
    ("δ Dra", "ε Dra"),
    ("δ Dra", "φ Dra"),
    ("φ Dra", "χ Dra"),
    ("φ Dra", "ω Dra"),
    ("ω Dra", "ζ Dra"),
    ("ζ Dra", "η Dra"),
    ("η Dra", "θ Dra"),
    ("θ Dra", "ι Dra"),
    ("ι Dra", "Thuban"),
    ("Thuban", "κ Dra"),
    ("κ Dra", "λ Dra"),
])


star_info = star_info.loc[list(g.nodes)]

# Strip the " Dra" suffix for labeling, since the constellation is known
labels = {n: n.rstrip(" Dra") for n in g.nodes}

# Create a size that correlates with magnitude (brighter stars are larger)
scale = star_info["vis. mag."].min() - star_info["vis. mag."].max()
star_size = 13 - 15 * (star_info["vis. mag."].max() - star_info["vis. mag."]) / scale

# Plot the constellation
fig, ax = plt.subplots(figsize=(9, 6))
ax.patch.set_facecolor("black")
artist = ipx.network(
    g,
    layout=star_info[["lon", "lat"]],
    ax=ax,
    vertex_facecolor=star_info["vis. mag."],
    vertex_cmap="viridis_r",
    vertex_edgecolor="white",
    edge_color="white",
    edge_linewidth=2,
    vertex_alpha=0.8,
    vertex_label_color="white",
    vertex_size=star_size,
    vertex_label_size=14,
    title="Stars of the Draco constellation",
    edge_curved=False,
    node_labels=labels,
)[0]

# Add colorbar based on star magnitude
fig.colorbar(artist.get_nodes(), ax=ax, label="Visual Magnitude", orientation="vertical", pad=0.02)
<matplotlib.colorbar.Colorbar object at 0x7dd1a600f4d0>
Note
Angular coordinates are taken to have a Cartesian meaning for the sake of simplicity. This leads to some distorsion compared to how the real constellation looks like on a celestial sphere.
Total running time of the script: (0 minutes 0.101 seconds)