Note
Go to the end to download the full example code.
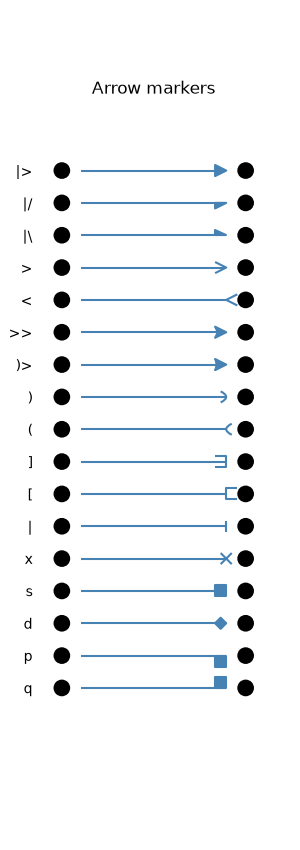
Arrowheads#
This example showcases various types of arrowheads for connected graphs.
import networkx as nx
import matplotlib.pyplot as plt
import iplotx as ipx

arrow_markers = ["|>", "|/", "|\\", ">", "<", ">>", ")>", ")", "(", "]", "[", "|",
                 "x", "s", "d", "p", "q"]
n = len(arrow_markers)
G = nx.DiGraph()
G.add_edges_from([(f"l{i}", f"r{i}") for i in range(n)])
layout = {f"l{i}": (0, -i) for i in range(n)}
layout.update({f"r{i}": (1, -i) for i in range(n)})

fig, ax = plt.subplots(figsize=(3, 8.5))
ipx.network(
    G,
    layout=layout,
    ax=ax,
    vertex_size=12,
    edge_arrow_marker=arrow_markers,
    edge_arrow_height="width",
    edge_shrink=8,
    edge_color="steelblue",
    title="Arrow markers",
)
ax.set_yticks(list(range(-n + 1, 1))[::-1])
ax.set_yticklabels(arrow_markers)
ax.yaxis.set_tick_params(length=0)
Total running time of the script: (0 minutes 0.077 seconds)