Note
Go to the end to download the full example code.
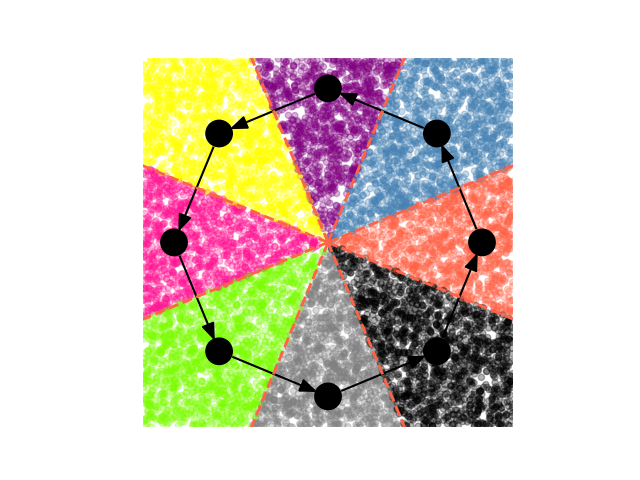
Voronoi tessellation#
This example shows how to combine iplotx visualisations with other tools such as scipy and vanilla matplotlib. This is one of the key strengths of iplotx over custom visualisations in many other packages: iplotx produces fully compliant matplotlib artists that can be combined with other matplotlib tools, including seaborn.
<matplotlib.collections.PathCollection object at 0x7dd1a6047610>
import igraph as ig
import numpy as np
import matplotlib.pyplot as plt
import iplotx as ipx
from scipy.spatial import Voronoi, voronoi_plot_2d
from scipy.spatial.distance import cdist

# Plot a graph with iplotx
g = ig.Graph.Ring(8, directed=True)
fig, ax = plt.subplots()
art = ipx.plot(
    g,
    ax=ax,
    layout="circle",
    aspect=1,
)[0]

# Add a Voronoi tasselation via scipy
vor = Voronoi(art.get_layout().values)
voronoi_plot_2d(
    vor,
    ax=ax,
    show_points=False,
    show_vertices=False,
    line_colors="tomato",
    line_style="-",
    line_width=2,
)
xmin, xmax = ax.get_xlim()
ymin, ymax = ax.get_ylim()

# Add random points and color them based on Voronoi region
palette = [
    "tomato",
    "steelblue",
    "purple",
    "yellow",
    "deeppink",
    "lawngreen",
    "grey",
    "black",
]
rngpoints = np.random.rand(10000, 2)
rngpoints *= np.array([xmax - xmin, ymax - ymin])
rngpoints += np.array([xmin, ymin])

colors = np.array(palette)[cdist(art.get_layout().values, rngpoints).argmin(axis=0)]
ax.scatter(
    rngpoints[:, 0],
    rngpoints[:, 1],
    c=colors,
    s=20,
    alpha=0.3,
    zorder=0.5,
)
Total running time of the script: (0 minutes 0.193 seconds)