Note
Go to the end to download the full example code.
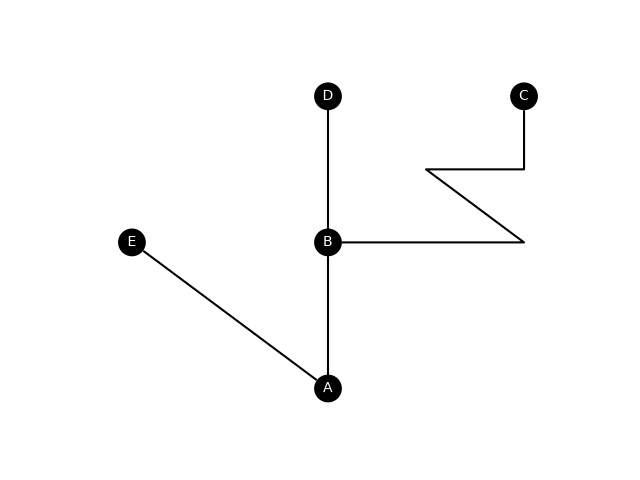
Edge waypoints#
This example demonstrates the use of edge waypoints.
import matplotlib.pyplot as plt
import numpy as np
import iplotx as ipx

g = {
    "edges": [
        ("A", "B"),
        ("B", "C"),
        ("B", "D"),
        ("A", "E"),
    ],
}
layout = {
    "A": (0, 0),
    "B": (0, 1),
    "C": (1, 2),
    "D": (0, 2),
    "E": (-1, 1),
}

fig, ax = plt.subplots()
ipx.network(
    g,
    layout=layout,
    ax=ax,
    vertex_labels=True,
    edge_waypoints=["none", [(1, 1), (0.5, 1.5), (1, 1.5)], "none", "none"],
)
plt.ion(); plt.show()
Total running time of the script: (0 minutes 0.036 seconds)