Note
Go to the end to download the full example code.
Cogent3 layouts#
This example shows how to reproduce cogent3 layouts using iplotx.
Note
cogent3 uses plotly as their default backend, whereas iplotx uses matplotlib. Each backend has pros and cons. In general, plotly is more directed towards web visualisation thanks to their JavaScript library, whereas matplotlib is probably more popular and supported outside of web environments.
import cogent3
import matplotlib.pyplot as plt
import iplotx as ipx
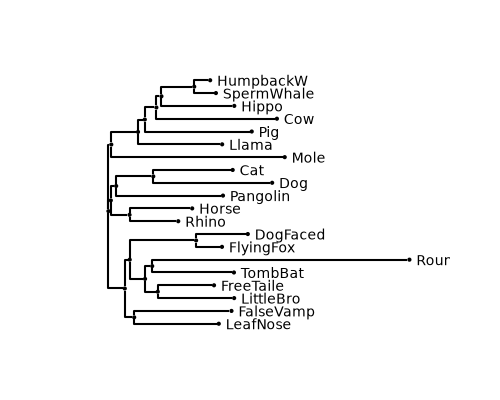
tree = cogent3.load_tree("data/tree-with-support.json")
fig, ax = plt.subplots(figsize=(5, 4))
art = ipx.tree(
tree,
ax=ax,
leaf_labels=True,
style="cogent3",
)
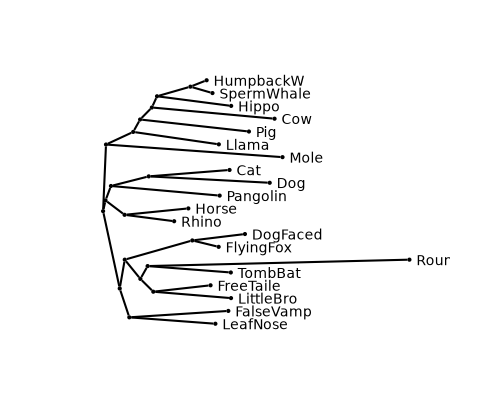
Angular layouts (without waypoints, looks more pointy) are supported:
fig, ax = plt.subplots(figsize=(5, 4))
art = ipx.tree(
    tree,
    layout="horizontal",
    ax=ax,
    leaf_labels=True,
    layout_angular=True,
    style="cogent3",
)
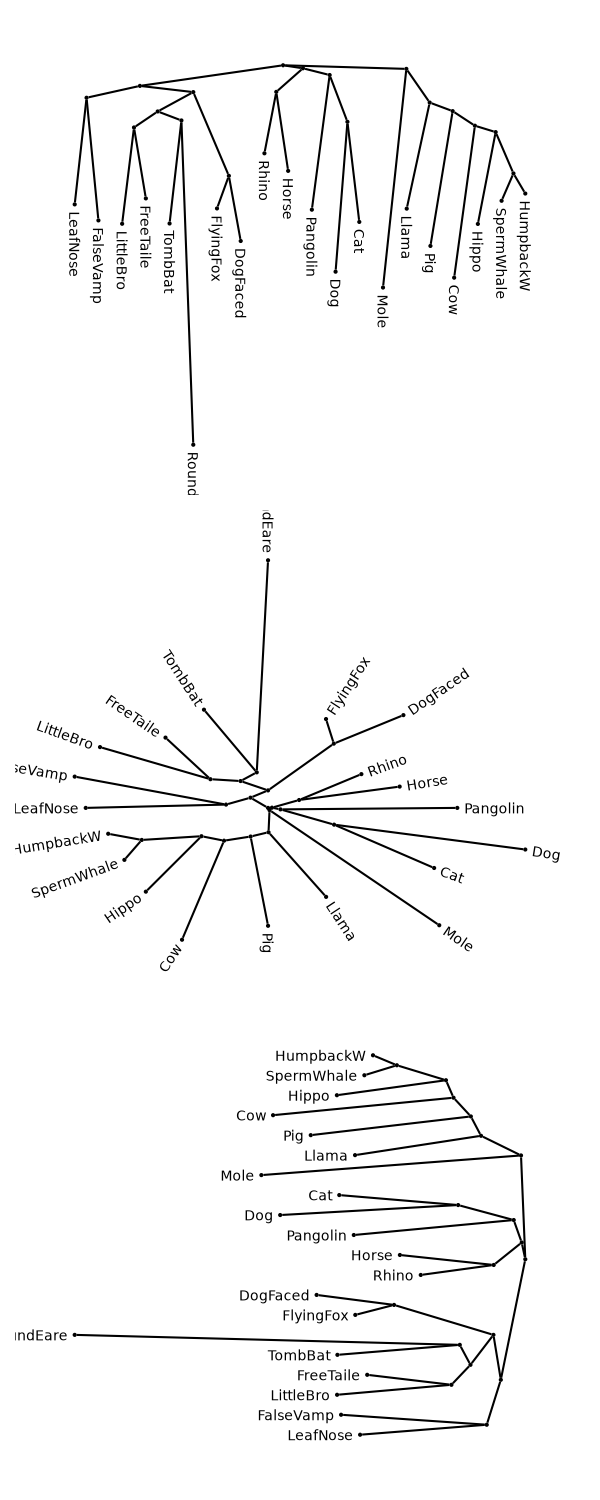
Vertical and radial layouts are also supported along the same lines:
fig, axs = plt.subplots(3, 1, figsize=(6, 15))
for ax, layout in zip(axs, ("vertical", "radial", "horizontal")):
    art = ipx.tree(
        tree,
        layout=layout,
        layout_orientation="left" if layout == "horizontal" else None,
        ax=ax,
        leaf_labels=True,
        layout_angular=True,
        style="cogent3",
    )
fig.tight_layout()
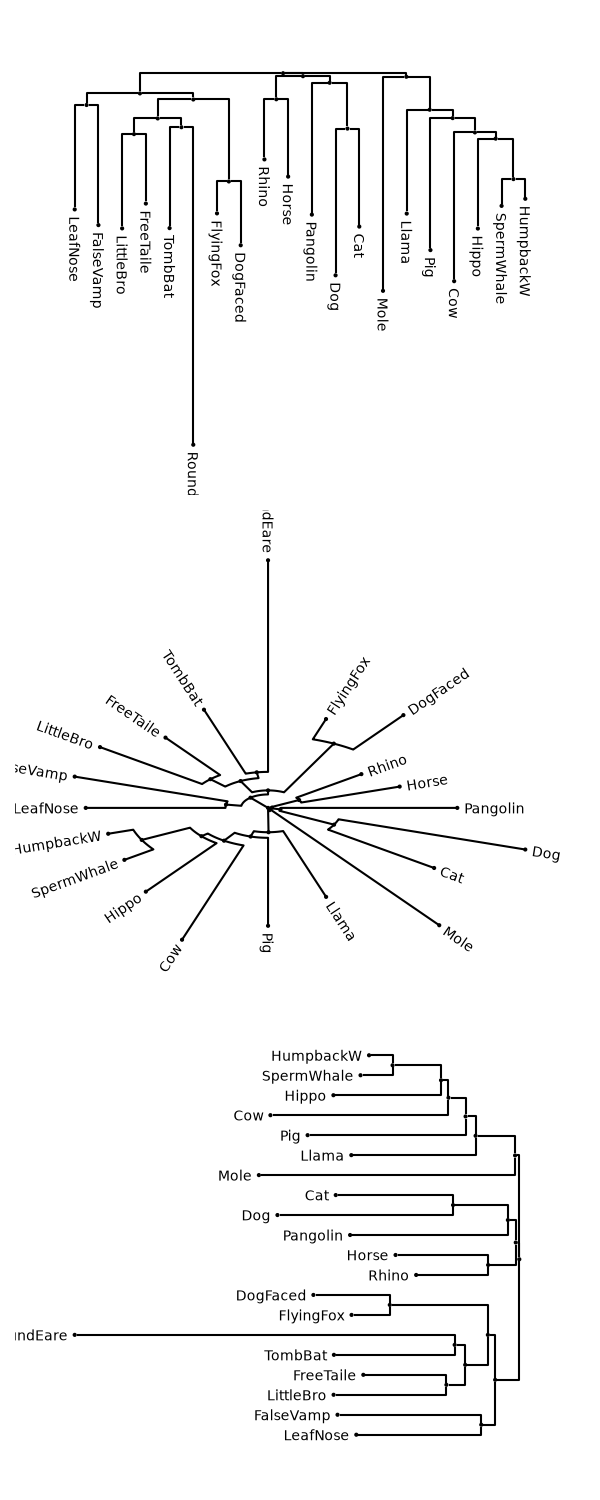
Nonangular trees can be used too:
fig, axs = plt.subplots(3, 1, figsize=(6, 15))
for ax, layout in zip(axs, ("vertical", "radial", "horizontal")):
    art = ipx.tree(
        tree,
        layout=layout,
        layout_orientation="left" if layout == "horizontal" else None,
        ax=ax,
        leaf_labels=True,
        layout_angular=False,
        style="cogent3",
    )
fig.tight_layout()
Total running time of the script: (0 minutes 0.715 seconds)