Note
Go to the end to download the full example code.
phyloframe tree#
This example shows how to plot trees from the phyloframe library, using Seaborn to overlay scatter points.
Phyloframe represents phylogenies within DataFrames in the alife standard format (i.e.,
edge list).
DataFrames may be passed to iplotx.tree() using phyloframe.legacy.alifestd_to_iplotx_pandas or phyloframe.legacy.alifestd_to_iplotx_polars.
import matplotlib.pyplot as plt
from phyloframe import legacy as pfl
import pandas as pd
import polars as pl
import seaborn as sns
import iplotx as ipx


def draw_scatter_tree(
    phylogeny_df,
    *,
    hue=None,
    size=None,
    style=None,
    c=None,
    ax=None,
    layout="vertical",
    scatter_kws=None,
    tree_kws=None,
):
    """Draw a phylogenetic tree with a seaborn scatter overlay.

    Adapted from `hstrat-synthesis
    <https://github.com/mmore500/hstrat-synthesis/blob/main/pylib/tree/_draw_scatter_tree.py>`_.

    Parameters
    ----------
    phylogeny_df : polars.DataFrame
        Alife-standard phylogeny with optional metadata columns.
    hue, size, style : str, optional
        Column names forwarded to :func:`seaborn.scatterplot`.
    c : str, sequence, or None
        Colour values; a column name or explicit array.
    ax : matplotlib.axes.Axes, optional
        Target axes.  Created if *None*.
    layout : str
        Tree layout forwarded to :func:`iplotx.tree`.
    scatter_kws : dict, optional
        Extra keyword arguments for :func:`seaborn.scatterplot`.
    tree_kws : dict, optional
        Extra keyword arguments for :func:`iplotx.tree`.
    """
    if ax is None:
        ax = plt.gca()
    if scatter_kws is None:
        scatter_kws = {}
    if tree_kws is None:
        tree_kws = {}

    try:
        phylogeny_df = phylogeny_df.to_pandas()
    except AttributeError:
        pass

    tree_artist = ipx.tree(
        pfl.alifestd_to_iplotx_pandas(phylogeny_df),
        ax=ax,
        layout=layout,
        **{"margins": 0.0, "edge_linewidth": 1.5, **tree_kws},
    )

    # Extract node positions — radial layouts need Cartesian offsets
    ipx_layout = tree_artist.get_layout()
    if layout == "radial":
        xs, ys = tree_artist.get_nodes().get_offsets().T
    else:
        xs, ys = ipx_layout.T.to_numpy()

    pos = {
        node._id: (x, y) for node, (x, y) in zip(ipx_layout.index, zip(xs, ys))
    }

    # Map positions back onto the DataFrame
    plot_df = phylogeny_df.assign(
        __x__=phylogeny_df["id"]
        .map({k: v[0] for k, v in pos.items()})
        .astype(float),
        __y__=phylogeny_df["id"]
        .map({k: v[1] for k, v in pos.items()})
        .astype(float),
    )

    # Resolve colour argument
    if isinstance(c, str):
        c = plot_df[c].fillna("none").tolist()
    elif c is None:
        c = "none"

    sns.scatterplot(
        plot_df,
        x="__x__",
        y="__y__",
        hue=hue,
        size=size,
        style=style,
        c=c,
        ax=ax,
        **{"legend": False, "zorder": 5, **scatter_kws},
    )
    return ax
Radial scatter tree#
A small phylogeny with scatter points displayed using the "radial" layout.
vertebrate_df = pd.DataFrame(
    {
        "id": [0, 1, 2, 3, 4, 5, 6, 7, 8],
        "ancestor_id": [0, 0, 0, 1, 1, 2, 2, 6, 6],
        "origin_time": [0, 2, 3, 5, 5, 6, 6, 7, 7],
        "taxon_label": [
            None,
            None,
            None,
            "Salmon",
            "Seahorse",
            "Parrot",
            None,
            "Cat",
            "Mouse",
        ],
        "group": [
            None,
            None,
            None,
            "fish",
            "fish",
            "bird",
            None,
            "mammal",
            "mammal",
        ],
    }
)

fig, ax = plt.subplots(figsize=(5, 5))
draw_scatter_tree(
    vertebrate_df.assign(taxon_label="\n" + vertebrate_df["taxon_label"]),
    hue="group",
    style="group",
    ax=ax,
    layout="radial",
    scatter_kws=dict(
        edgecolor="white",
        linewidth=0.8,
        legend="brief",
        markers=["o", "v", "^"],
        palette="Set2",
        s=220,
        zorder=1,
    ),
    tree_kws=dict(
        aspect=1,
        leaf_labels=True,
        margins=0.17,
        style=[
            "tree",
            dict(
                vertex=dict(
                    label=dict(
                        color="gray",
                    ),
                ),
                leaf=dict(
                    label=dict(
                        verticalalignment="baseline",
                        hmargin=12,
                    )

                ),
            ),
        ],
    ),
)
fig.tight_layout()
plt.show()

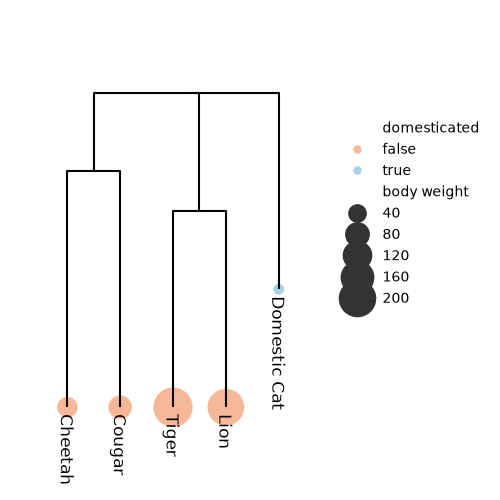
Vertical scatter tree#
A small phylogeny with scatter points displayed using the "vertical"
layout.
body_weights = {
    "species": ["Lion", "Tiger", "Cougar", "Cheetah", "Domestic Cat"],
    "body weight": [190.0, 220.0, 70.0, 50.0, 4.5],
}
felid_df = (
    pfl.alifestd_from_newick_polars(
        "((Lion:0.05,Tiger:0.05):0.03,(Cougar:0.06,Cheetah:0.06):0.02,'Domestic Cat':0.05);",
    )
    .pipe(pfl.alifestd_mark_leaves_polars)
    .with_columns(
        domesticated=pl.when(pl.col("is_leaf"))
        .then(pl.col("taxon_label") == "Domestic Cat")
        .otherwise(None)
        .cast(str)
    )
    .join(
        pl.DataFrame(body_weights),
        left_on="taxon_label",
        right_on="species",
        how="left",
    )
)

fig2, ax2 = plt.subplots(figsize=(5, 5))
draw_scatter_tree(
    felid_df,
    hue="domesticated",
    size="body weight",
    ax=ax2,
    layout="vertical",
    scatter_kws=dict(
        edgecolor="none",
        linewidth=0.5,
        legend="brief",
        palette="RdBu",
        sizes=(60, 800),
        zorder=-100,
    ),
    tree_kws=dict(
        leaf_labels=True,
        margins=0.15,
    ),
)
sns.move_legend(ax2, "upper left", bbox_to_anchor=(1, 0.8), frameon=False)
fig2.tight_layout()
Total running time of the script: (0 minutes 2.675 seconds)