Note
Go to the end to download the full example code.
Chess masters#
This example from networkx shows the relatinoships between chess masters. The example has a lot of network analysis code that is somewhat irrelevant for iplotx and is kept to demonstrate functional parity.
Note
The layout of this graph is computed with the Kamada-Kawai algorithm. In networkx, that requires the scipy package to be installed. Here, we also demonstrate the alternative, which is to convert the network to igraph, which has an internal implementation of the algorithm. While the exact layout is not identical, it is equally accurate and visually similar.
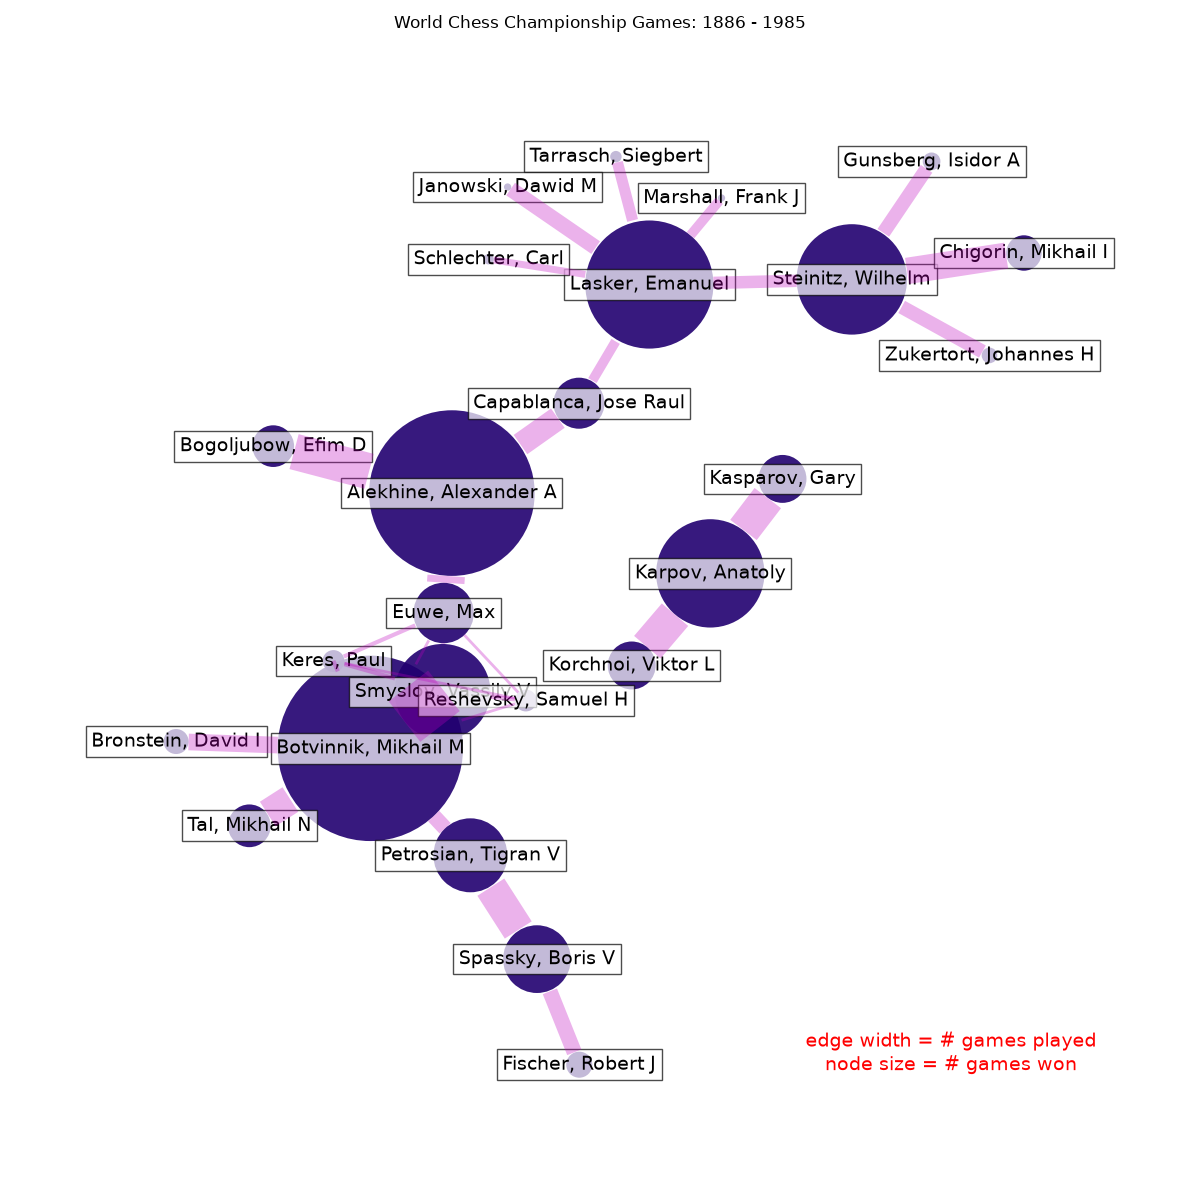
Loaded 685 chess games between 25 players

Note the disconnected component consisting of:
['Kasparov, Gary', 'Korchnoi, Viktor L', 'Karpov, Anatoly']

From a total of 237 different openings,
the following games used the Sicilian opening
with the Najdorff 7...Qb6 "Poisoned Pawn" variation.

Spassky, Boris V vs Fischer, Robert J
   Event: World Championship 28th
   Site: Reykjavik ISL
   Date: 1972.07.25
   Round: 7
   Result: 1/2-1/2
   WhiteElo: 2660
   BlackElo: 2785
   ECO: B97
   EventDate: 1972.07.11


Spassky, Boris V vs Fischer, Robert J
   Event: World Championship 28th
   Site: Reykjavik ISL
   Date: 1972.08.06
   Round: 11
   Result: 1-0
   WhiteElo: 2660
   BlackElo: 2785
   ECO: B97
   EventDate: 1972.07.11
import numpy as np
import networkx as nx
import igraph as ig
import matplotlib.pyplot as plt
import iplotx as ipx


# tag names specifying what game info should be
# stored in the dict on each digraph edge
game_details = ["Event", "Date", "Result", "ECO", "Site"]


def chess_pgn_graph(pgn_file="data/chess_masters_WCC.pgn.bz2"):
    """Read chess games in pgn format in pgn_file.

    Filenames ending in .bz2 will be uncompressed.

    Return the MultiDiGraph of players connected by a chess game.
    Edges contain game data in a dict.

    """
    import bz2

    G = nx.MultiDiGraph()
    game = {}
    with bz2.BZ2File(pgn_file) as datafile:
        lines = [line.decode().rstrip("\r\n") for line in datafile]
    for line in lines:
        if line.startswith("["):
            tag, value = line[1:-1].split(" ", 1)
            game[str(tag)] = value.strip('"')
        else:
            # empty line after tag set indicates
            # we finished reading game info
            if game:
                white = game.pop("White")
                black = game.pop("Black")
                G.add_edge(white, black, **game)
                game = {}
    return G


G = chess_pgn_graph()

print(f"Loaded {G.number_of_edges()} chess games between {G.number_of_nodes()} players\n")

# identify connected components of the undirected version
H = G.to_undirected()
Gcc = [H.subgraph(c) for c in nx.connected_components(H)]
if len(Gcc) > 1:
    print(f"Note the disconnected component consisting of:\n{Gcc[1].nodes()}")

# find all games with B97 opening (as described in ECO)
openings = {game_info["ECO"] for (white, black, game_info) in G.edges(data=True)}
print(f"\nFrom a total of {len(openings)} different openings,")
print("the following games used the Sicilian opening")
print('with the Najdorff 7...Qb6 "Poisoned Pawn" variation.\n')

for white, black, game_info in G.edges(data=True):
    if game_info["ECO"] == "B97":
        summary = f"{white} vs {black}\n"
        for k, v in game_info.items():
            summary += f"   {k}: {v}\n"
        summary += "\n"
        print(summary)

# make new undirected graph H without multi-edges
H = nx.Graph(G)

# edge width is proportional number of games played
edgewidth = [len(G.get_edge_data(u, v)) for u, v in H.edges()]

# node size is proportional to number of games won
wins = dict.fromkeys(G.nodes(), 0.0)
for u, v, d in G.edges(data=True):
    r = d["Result"].split("-")
    if r[0] == "1":
        wins[u] += 1.0
    elif r[0] == "1/2":
        wins[u] += 0.5
        wins[v] += 0.5
    else:
        wins[v] += 1.0
nodesize = [wins[v] * 1.5 for v in H]

# Generate layout for visualization
try:
    pos = nx.kamada_kawai_layout(H)
    ylegend = 0.1
except ImportError:
    Hig = ig.Graph.from_networkx(H)
    layout = Hig.layout("kk", weights=edgewidth).coords
    pos = {x: np.asarray(row) for x, row in zip(Hig.vs["_nx_name"], layout)}
    ylegend = 0.89

fig, ax = plt.subplots(figsize=(12, 12))
ipx.plot(
    H,
    layout=pos,
    ax=ax,
    title="World Chess Championship Games: 1886 - 1985",
    vertex_labels=True,
    style={
        "vertex": {
            "facecolor": "#210070",
            "edgecolor": "none",
            "alpha": 0.9,
            "size": nodesize,
            "label": {
                "color": "black",
                "size": 14,
                "bbox": {
                    "facecolor": "white",
                    "edgecolor": "black",
                    "alpha": 0.7,
                },
            },
        },
        "edge": {
            "alpha": 0.3,
            "linewidth": edgewidth,
            "color": "m",
        },
    },
)

ax.text(
    0.80,
    ylegend,
    "edge width = # games played\nnode size = # games won",
    size=14,
    horizontalalignment="center",
    transform=ax.transAxes,
    color="red",
)

ax.margins(0.1, 0.05)
fig.tight_layout()
Total running time of the script: (0 minutes 0.251 seconds)