Note
Go to the end to download the full example code.
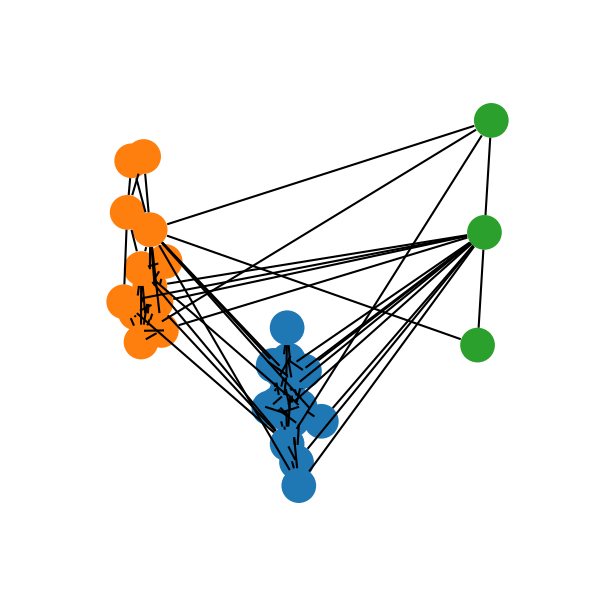
Cluster of Southern Women#
This example from networkx shows how to use coloring and custom layout as a dictionary.
[<iplotx.network.NetworkArtist object at 0x7dd1a57f2ad0>]
import networkx as nx
import numpy as np
import matplotlib.pyplot as plt
import iplotx as ipx

G = nx.davis_southern_women_graph()
communities = nx.community.greedy_modularity_communities(G)

# Layout does not appear deterministic, so we use a fixed layout from one run of spring_layout
pos = {
    "Evelyn Jefferson": np.array([-25.68131066, -10.80854424]),
    "Laura Mandeville": np.array([-25.55280383, -10.99674201]),
    "Theresa Anderson": np.array([-25.38187247, -10.86875164]),
    "Brenda Rogers": np.array([-25.67901346, -11.17009239]),
    "Charlotte McDowd": np.array([-25.85576192, -11.09635554]),
    "Frances Anderson": np.array([-24.97100665, -10.80341997]),
    "Eleanor Nye": np.array([-25.22178561, -11.61473984]),
    "Pearl Oglethorpe": np.array([-24.43628739, -11.25006292]),
    "Ruth DeSand": np.array([-25.15041064, -11.82194973]),
    "E1": np.array([-26.10000875, -11.13170858]),
    "E2": np.array([-25.52047415, -10.41822091]),
    "E3": np.array([-25.48205106, -10.7056092]),
    "E4": np.array([-25.96271954, -10.75283759]),
    "E5": np.array([-25.35150057, -11.23805354]),
    "E6": np.array([-25.1129681, -11.11829674]),
    "E7": np.array([-25.5206234, -11.4515497]),
    "E13": np.array([-29.38952624, -9.82903937]),
    "Nora Fayette": np.array([-30.14866675, -9.89241409]),
    "Olivia Carleton": np.array([-30.44992786, -8.93390847]),
    "Katherina Rogers": np.array([-29.87511453, -10.05207037]),
    "Helen Lloyd": np.array([-30.70287724, -10.18706022]),
    "E12": np.array([-29.97554058, -10.44474811]),
    "E14": np.array([-30.32816285, -10.28626239]),
    "Sylvia Avondale": np.array([-29.68181361, -10.1960916]),
    "Myra Liddel": np.array([-29.50794269, -10.44247286]),
    "E9": np.array([-29.86346377, -9.54678644]),
    "Flora Price": np.array([-30.07123751, -8.8956997]),
    "E10": np.array([-30.15355559, -10.54517655]),
    "E11": np.array([-30.59292037, -9.39236595]),
    "E8": np.array([-19.26284314, -9.57050676]),
    "Dorothy Murchison": np.array([-19.48148306, -10.57263599]),
    "Verne Sanderson": np.array([-19.0455969, -8.57476521]),
}

# Nodes colored by cluster
node_color = {}
for nodes, clr in zip(communities, ("tab:blue", "tab:orange", "tab:green")):
    for node in nodes:
        node_color[node] = clr

fig, ax = plt.subplots(figsize=(6, 6))
ipx.plot(
    G,
    layout=pos,
    style={
        "vertex": {
            "facecolor": node_color,
            "linewidth": 0,
            "size": 25,
        }
    },
    ax=ax,
)
Total running time of the script: (0 minutes 0.111 seconds)