Note
Go to the end to download the full example code.
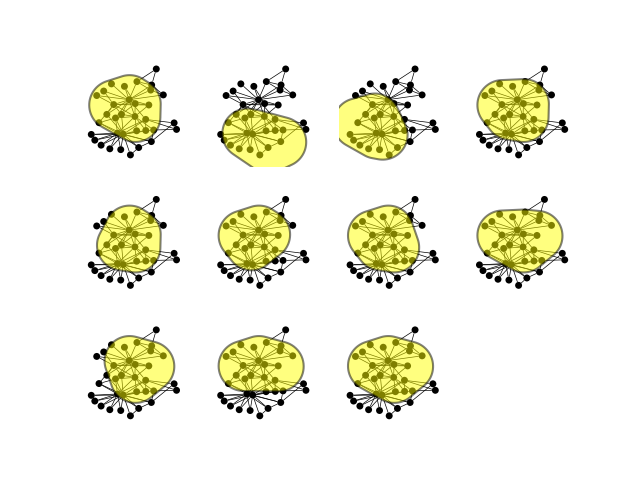
Cliques#
This example from igraph shows how to compute and visualize cliques and highlight them.
import igraph as ig
import matplotlib.pyplot as plt
import iplotx as ipx

g = ig.Graph.Famous("Zachary")
layout = g.layout("auto")

cliques = g.cliques(4, 4)

fig, axs = plt.subplots(3, 4)
axs = axs.ravel()
for clique, ax in zip(cliques, axs):
    ipx.plot(
        network=g,
        grouping=ig.VertexCover(g, [clique]),
        layout=layout,
        ax=ax,
        style={
            "vertex": {
                "size": 5,
            },
            "edge": {
                "linewidth": 0.5,
            },
            "grouping": {
                "facecolor": "yellow",
            },
        },
    )
axs[-1].axis("off")  # Hide the last empty subplot
(np.float64(0.0), np.float64(1.0), np.float64(0.0), np.float64(1.0))
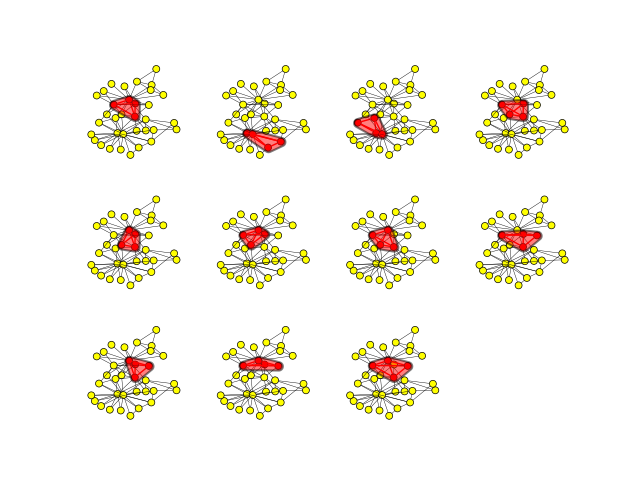
Advanced: improving plotting style#
If you want a little more style, you can color the vertices/edges within each clique to make them stand out:
fig, axs = plt.subplots(3, 4)
axs = axs.ravel()
for clique, ax in zip(cliques, axs):
    # Color vertices yellow/red based on whether they are in this clique
    g.vs["color"] = "yellow"
    g.vs[clique]["color"] = "red"

    # Color edges black/red based on whether they are in this clique
    clique_edges = g.es.select(_within=clique)
    g.es["color"] = "black"
    clique_edges["color"] = "red"
    # also increase thickness of clique edges
    g.es["width"] = 0.3
    clique_edges["width"] = 1

    ipx.plot(
        network=g,
        grouping=ig.VertexCover(g, [clique]),
        layout=layout,
        ax=ax,
        style={
            "vertex": {
                "size": 5,
                "facecolor": g.vs["color"],
                "edgecolor": "black",
                "linewidth": 0.5,
            },
            "edge": {
                "linewidth": g.es["width"],
                "color": g.es["color"],
            },
            "grouping": {
                "facecolor": "red",
                "vertexpadding": 3,
            },
        },
    )
axs[-1].axis("off")  # Hide the last empty subplot
(np.float64(0.0), np.float64(1.0), np.float64(0.0), np.float64(1.0))
Total running time of the script: (0 minutes 1.781 seconds)