Note
Go to the end to download the full example code.
Knuth Miles US cities#
This example from newtorkx shows an undirected graph of 128 US cities.
import gzip
import re
import matplotlib.pyplot as plt
import networkx as nx
import iplotx as ipx
# Ignore any warnings related to downloading shpfiles with cartopy
import warnings
warnings.simplefilter("ignore")
def miles_graph():
"""Return the cites example graph in miles_dat.txt
from the Stanford GraphBase.
"""
# open file miles_dat.txt.gz (or miles_dat.txt)
fh = gzip.open("data/knuth_miles.txt.gz", "r")
G = nx.Graph()
G.position = {}
G.population = {}
cities = []
for line in fh.readlines():
line = line.decode()
if line.startswith("*"): # skip comments
continue
numfind = re.compile(r"^\d+")
if numfind.match(line): # this line is distances
dist = line.split()
for d in dist:
G.add_edge(city, cities[i], weight=int(d))
i = i + 1
else: # this line is a city, position, population
i = 1
(city, coordpop) = line.split("[")
cities.insert(0, city)
(coord, pop) = coordpop.split("]")
(y, x) = coord.split(",")
G.add_node(city)
# assign position - Convert string to lat/long
G.position[city] = (-float(x) / 100, float(y) / 100)
G.population[city] = float(pop) / 1000
return G
G = miles_graph()
print("Loaded miles_dat.txt containing 128 cities.")
print(G)
# make new graph of cites, edge if less than 300 miles between them
H = nx.Graph()
for v in G:
H.add_node(v)
for u, v, d in G.edges(data=True):
if d["weight"] < 300:
H.add_edge(u, v)
# nodes colored by degree sized by population
node_color = [float(H.degree(v)) for v in H]
# plot with iplotx
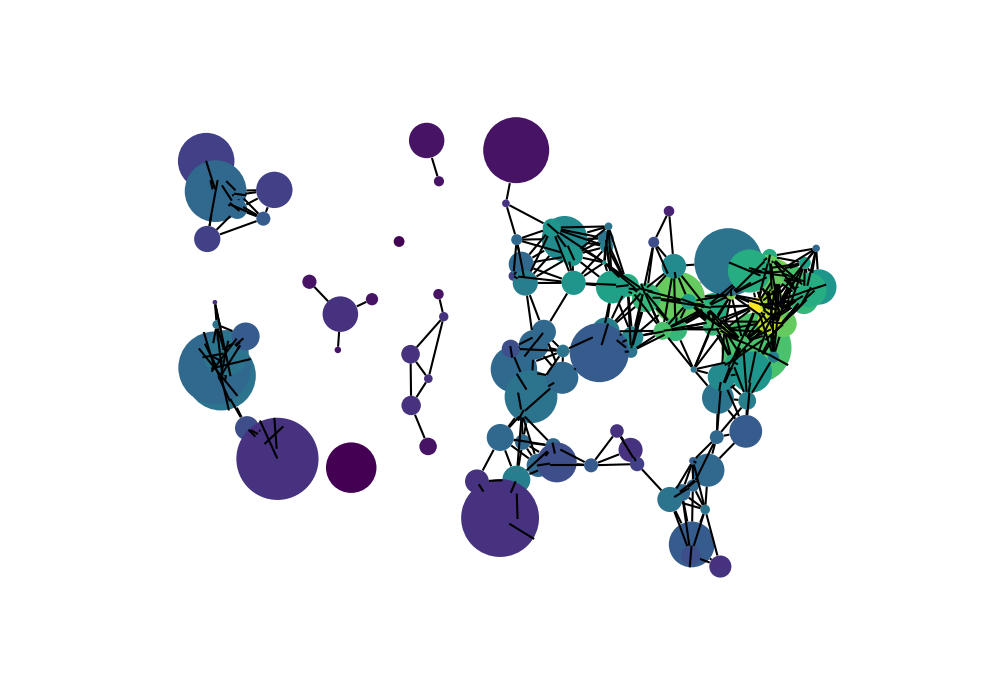
fig, ax = plt.subplots(figsize=(10, 7))
ipx.plot(
H,
layout=G.position,
ax=ax,
style={
"vertex": {
"size": [2 * G.population[v] ** 0.5 for v in H],
"facecolor": node_color,
"cmap": "viridis",
}
},
)
Loaded miles_dat.txt containing 128 cities.
Graph with 128 nodes and 8128 edges

[<iplotx.network.NetworkArtist object at 0x7dd1a57f3610>]
If you compare the style settings with the networkx example, you notice that iplotx sets the vertex diameter proportional with the “size” parameters, while networkx follows the pylab.scatter convention of scaling the diameter of each dot with the square root of the chosen size. Therefore, to recover the same plot as in the networkx example, we need to scale the size manually with the square root of the population.
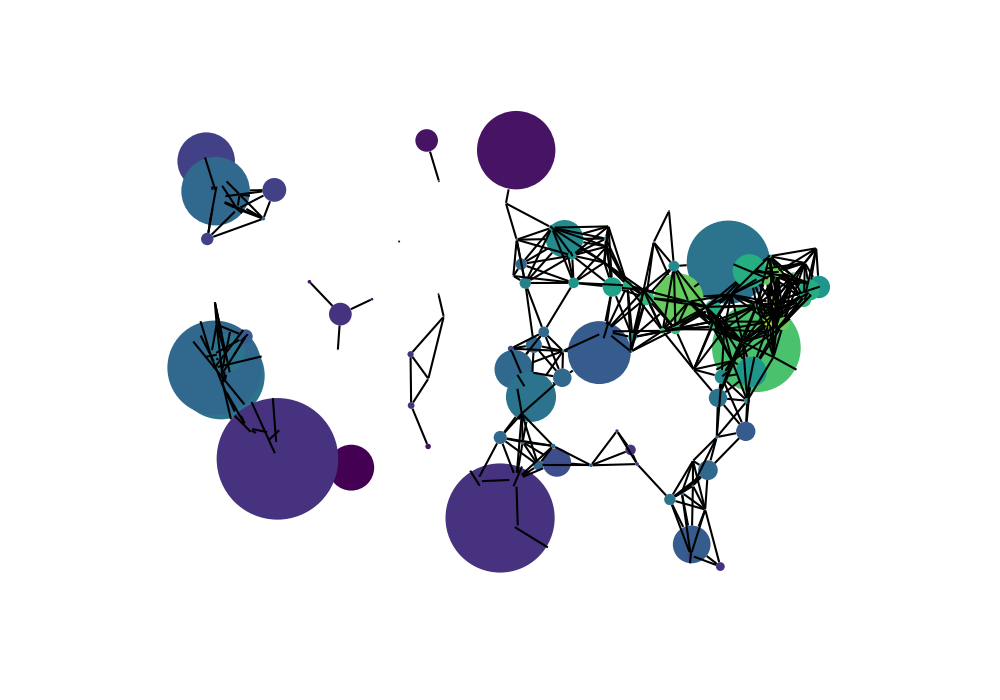
If we scale the vertex diameter with the population, it would look like this:
fig, ax = plt.subplots(figsize=(10, 7))
ipx.plot(
    H,
    layout=G.position,
    ax=ax,
    style={
        "vertex": {
            "size": [0.1 * G.population[v] for v in H],
            "facecolor": node_color,
            "cmap": "viridis",
        }
    },
)
[<iplotx.network.NetworkArtist object at 0x7dd1a57f2710>]
As you can see, the plot is almost identical but larger cities are more prominent.
Note
There is no right or wrong behaviour here. In fact, not even matplotlib is internally consistent with this, and seaborn and matplotlib use different conventions. If you want to have more dynamic range (i.e. see smaller dots more clearly), scaling with the square root like in networkx, or even with the cubic root or logarithm of the size is a good idea. If you want the user to imagine diameters/linear sizes as related to the population, you can use a linear scaling, which is the default in iplotx.
If you are curious about why plotx scales linearly with the diameter, the explanation is quite simple. networkx and others take the square root under the assumption that in that way the area of the node marker is proportional to the chosen size. However, that works less well for certain shapes, such as crosses, X, or lines. In that (not entirely uncommon) case, there is no area as such and the scaling as the square root ends up becoming a headache for everyone. This is no criticism of networkx, which is great. Just a little backstory.
Total running time of the script: (0 minutes 0.931 seconds)