Note
Go to the end to download the full example code.
Editing artists after plotting#
One of the strengths of iplotx is the support for editing artists after they have been plotted the first time without making a whole new figure.
In this example, we will change vertices, edges, arrows, etc. and check out how they look like.
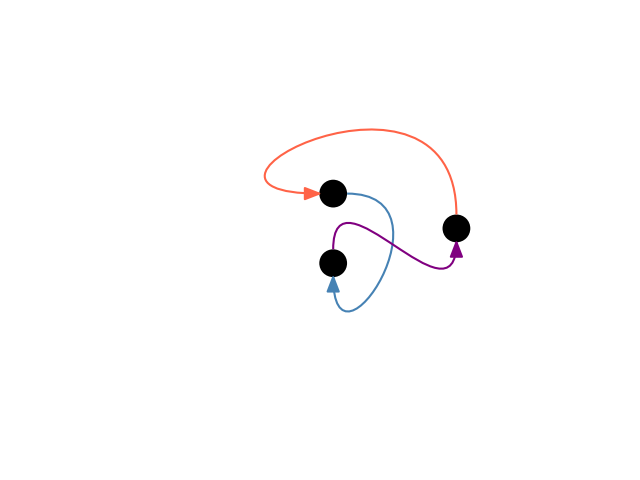
This is the vanilla version, taken from the “Ports” gallery example:
import igraph as ig
import iplotx as ipx

g = ig.Graph.Ring(3, directed=True)

artist = ipx.network(
    g,
    layout="circle",
    edge_curved=True,
    edge_ports=[
        ("n", "w"),  # exit from the top, enter from the left
        ("e", "s"),  # exit from the right, enter from the bottom
        ("n", "s"),  # exit from the top, enter from the bottom
    ],
    edge_tension=[1.5, 1.8, 0.8],
    edge_color=["tomato", "steelblue", "purple"],
)[0]
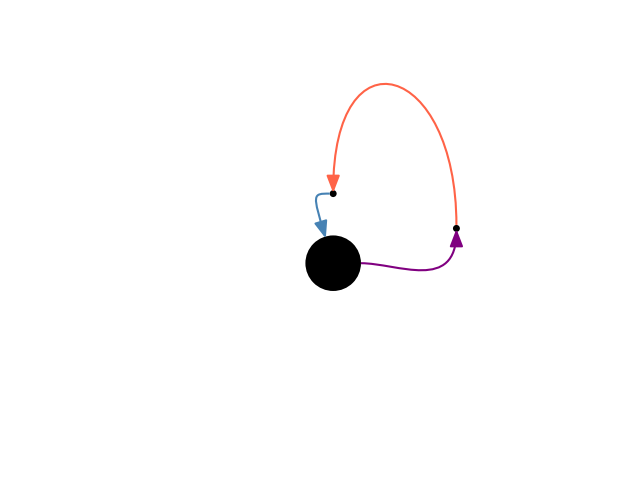
Now we can change the vertex sizes:
# sphinx_gallery_thumbnail_number = 2
# SAME BLOCK AS BEFORE, ONLY NEEDED TO MAKE A NEW FIGURE
artist = ipx.network(
    g,
    layout="circle",
    edge_curved=True,
    edge_ports=[
        ("n", "w"),  # exit from the top, enter from the left
        ("e", "s"),  # exit from the right, enter from the bottom
        ("n", "s"),  # exit from the top, enter from the bottom
    ],
    edge_tension=[1.5, 1.8, 0.8],
    edge_color=["tomato", "steelblue", "purple"],
)[0]
# END OF SAME BLOCK

artist.get_vertices().set_sizes([5, 5, 40])
artist.get_edges().set_ports(
    [
        ("n", "n"),
        ("w", None),
        ("e", "s"),
    ]
)
artist.get_edges().set_tension([1.3, 0.3, 0.5])
Total running time of the script: (0 minutes 0.059 seconds)