Note
Go to the end to download the full example code.
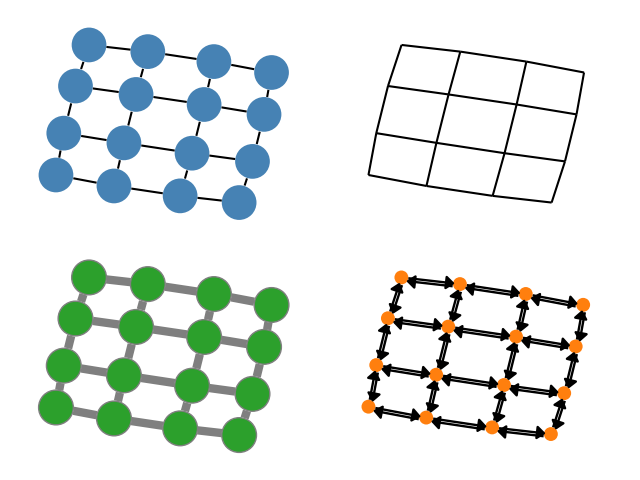
Four grids#
This example from networkx shows different stylings for the same grid.
import matplotlib.pyplot as plt
import networkx as nx
import iplotx as ipx

G = nx.grid_2d_graph(4, 4)  # 4x4 grid

pos = nx.spring_layout(G, iterations=100, seed=39775)

# Create a 2x2 subplot
fig, all_axes = plt.subplots(2, 2)
axs = all_axes.flat

ipx.plot(
    G,
    layout=pos,
    ax=axs[0],
    style={
        "vertex": {
            "size": 25,
            "facecolor": "steelblue",
            "edgecolor": "none",
        }
    },
)

ipx.plot(
    G,
    layout=pos,
    ax=axs[1],
    style={
        "vertex": {
            "size": 0,
        }
    },
)

ipx.plot(
    G,
    layout=pos,
    ax=axs[2],
    style={
        "vertex": {
            "size": 25,
            "facecolor": "tab:green",
            "edgecolor": "tab:gray",
        },
        "edge": {
            "linewidth": 6,
            "color": "tab:gray",
        },
    },
)

H = G.to_directed()

ipx.plot(
    H,
    layout=pos,
    ax=axs[3],
    style={
        "vertex": {
            "facecolor": "tab:orange",
            "edgecolor": "none",
            "size": 10,
        },
        "edge": {
            "linewidth": 1.7,
            "offset": 0,
            "arrow": {
                "height": 5,
                "marker": "|>",
            },
        },
    },
)

# Set margins for the axes so that nodes aren't clipped
for ax in axs:
    ax.margins(0.10)
fig.tight_layout()
Total running time of the script: (0 minutes 0.221 seconds)