Note
Go to the end to download the full example code.
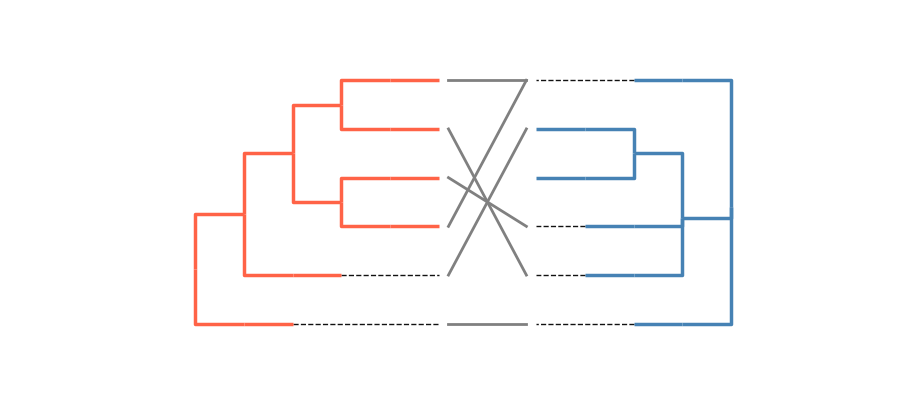
Double tree#
This example shows how to use iplotx to plot two trees facing each other, which is typical in coevolutionary studies.
from ete4 import Tree
from matplotlib import pyplot as plt
import iplotx as ipx

tree1 = Tree(
    "((),((),(((),()),((),()))));",
)


tree2 = Tree(
    "((),((),(),((),())),());",
)

fig, ax = plt.subplots(figsize=(9, 4))

# Plot first tree on the left
ipx.plotting.tree(
    tree1,
    ax=ax,
    aspect=1,
    edge_color="tomato",
    leaf_deep=True,
)

# Plot second tree on the right, facing left
ipx.plotting.tree(
    tree2,
    ax=ax,
    aspect=1,
    edge_color="steelblue",
    layout="horizontal",
    layout_orientation="left",
    layout_start=(11, 0),
    leaf_deep=True,
)

# Add lines connecting corresponding leaves
matches = [
    (0, 0),
    (1, 4),
    (2, 5),
    (3, 2),
    (4, 1),
    (5, 5),
]
for y1, y2 in matches:
    ax.plot(
        [5.2, 6.8], [y1, y2], color="gray", linewidth=2,
    )

iplotx has a dedicated function for double trees, which virtually the same result with less code:
fig, ax = plt.subplots(figsize=(9, 4))
ipx.doubletree(
    tree1,
    tree2,
    ax=ax,
    kwargs_left=dict(
        leaf_deep=True,
        edge_color="tomato",
    ),
    kwargs_right=dict(
        leaf_deep=True,
        edge_color="steelblue",
    ),
    gap=2,
    aspect=1,
)

# Add lines connecting corresponding leaves
# NOTE: The layout is horizontally centered now
matches = [
    (0, 0),
    (1, 4),
    (2, 5),
    (3, 2),
    (4, 1),
    (5, 5),
]
for y1, y2 in matches:
    ax.plot(
        [-0.3, 1.3], [y1, y2], color="gray", linewidth=2,
    )
Total running time of the script: (0 minutes 0.129 seconds)