Note
Go to the end to download the full example code.
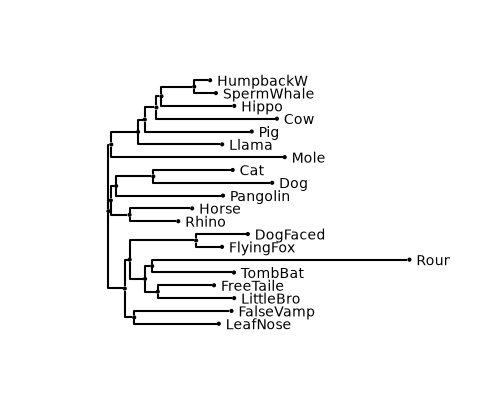
Branch support#
This example shows how to visualise support values for clades or branches.
import cogent3
import matplotlib.pyplot as plt
import iplotx as ipx

tree = cogent3.load_tree("data/tree-with-support.json")

fig, ax = plt.subplots(figsize=(5, 4))
art = ipx.tree(
    tree,
    ax=ax,
    leaf_labels=True,
    style="cogent3",
    show_support=True,
)
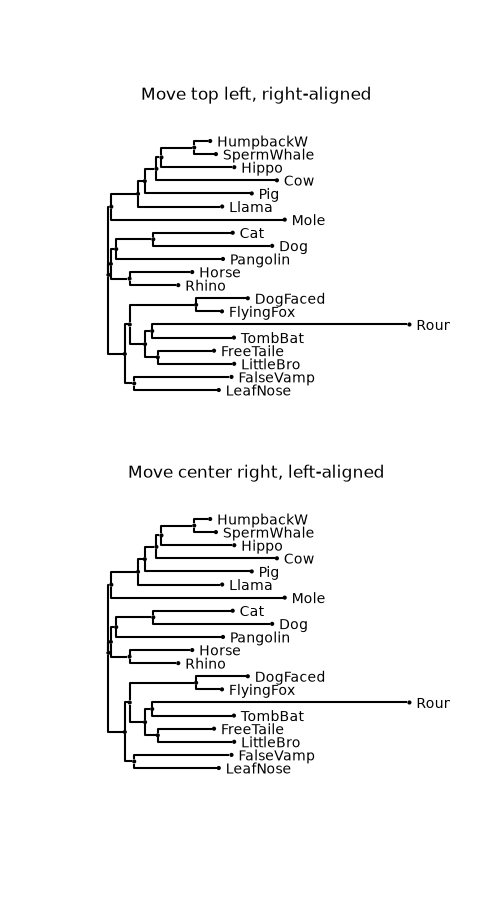
The location of the support vertex labels can be tuned:
fig, axs = plt.subplots(2, 1, figsize=(5, 9))
art = ipx.tree(
    tree,
    ax=axs[0],
    leaf_labels=True,
    style="cogent3",
    show_support=True,
    vertex_label_hmargin=-1,
    vertex_label_vmargin=5,
    vertex_label_horizontalalignment="right",
    title="Move top left, right-aligned",
)
art = ipx.tree(
    tree,
    ax=axs[1],
    leaf_labels=True,
    style="cogent3",
    show_support=True,
    vertex_label_hmargin=+1,
    vertex_label_vmargin=0,
    vertex_label_horizontalalignment="left",
    title="Move center right, left-aligned",
)
Warning
Using show_support=True overrides vertex labels. At the moment it is not possible to set both support values and external vetex labels. Of course, you can craft your own vertex labels to include support values if you want.
Total running time of the script: (0 minutes 0.269 seconds)