Note
Go to the end to download the full example code.
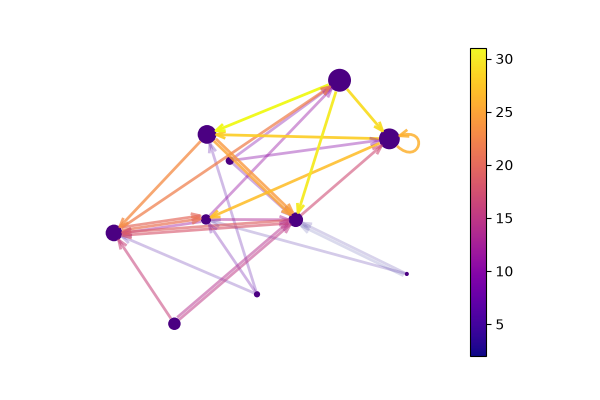
Colorbar#
This example from networkx shows how to use mappable colors and colormaps and how to connect them to a colorbar.
import networkx as nx
import matplotlib.pyplot as plt
import iplotx as ipx

seed = 13648  # Seed random number generators for reproducibility
G = nx.random_k_out_graph(10, 3, 0.5, seed=seed)
pos = nx.spring_layout(G, seed=seed)

node_sizes = [3 + 1.5 * i for i in range(len(G))]
M = G.number_of_edges()
edge_colors = list(range(2, M + 2))
edge_alphas = [(5 + i) / (M + 4) for i in range(M)]
cmap = plt.cm.plasma

fig, ax = plt.subplots(figsize=(6, 4))

network_artist = ipx.plot(
    network=G,
    ax=ax,
    layout=pos,
    style={
        "vertex": {
            "size": node_sizes,
            "facecolor": "indigo",
            "edgecolor": "none",
        },
        "edge": {
            "color": edge_colors,
            "alpha": edge_alphas,
            "cmap": cmap,
            "linewidth": 2,
            "offset": 0,
            "arrow": {
                "marker": ">",
                "width": 5,
            },
        },
    },
)[0]
fig.colorbar(
    network_artist.get_edges(),
    ax=ax,
)

<matplotlib.colorbar.Colorbar object at 0x7dd1a57f3750>
The arrow colors can be specified explicitely, in which case it overrides the edge color:
fig, ax = plt.subplots(figsize=(6, 4))

network_artist = ipx.plot(
    network=G,
    ax=ax,
    layout=pos,
    style={
        "vertex": {
            "size": node_sizes,
            "facecolor": "indigo",
            "edgecolor": "none",
        },
        "edge": {
            "color": edge_colors,
            "alpha": edge_alphas,
            "cmap": cmap,
            "linewidth": 2,
            "offset": 0,
            "arrow": {
                "marker": ">",
                "width": 5,
                "color": "black",  # Make arrows black
            },
        },
    },
)[0]
fig.colorbar(
    network_artist.get_edges(),
    ax=ax,
)

<matplotlib.colorbar.Colorbar object at 0x7dd1a582aad0>
The transparency (alpha) of the arrows is still determined by the edges unless specified:
fig, ax = plt.subplots(figsize=(6, 4))

network_artist = ipx.plot(
    network=G,
    ax=ax,
    layout=pos,
    style={
        "vertex": {
            "size": node_sizes,
            "facecolor": "indigo",
            "edgecolor": "none",
        },
        "edge": {
            "color": edge_colors,
            "alpha": edge_alphas,
            "cmap": cmap,
            "linewidth": 2,
            "offset": 0,
            "arrow": {
                "marker": ">",
                "width": 5,
                "color": "black",  # Make arrows black
                "alpha": 1.0,  # Set 100% opacity for arrows
            },
        },
    },
)[0]
fig.colorbar(
    network_artist.get_edges(),
    ax=ax,
)
<matplotlib.colorbar.Colorbar object at 0x7dd1a58e0e10>
Total running time of the script: (0 minutes 0.249 seconds)