Note
Go to the end to download the full example code.
Style library#
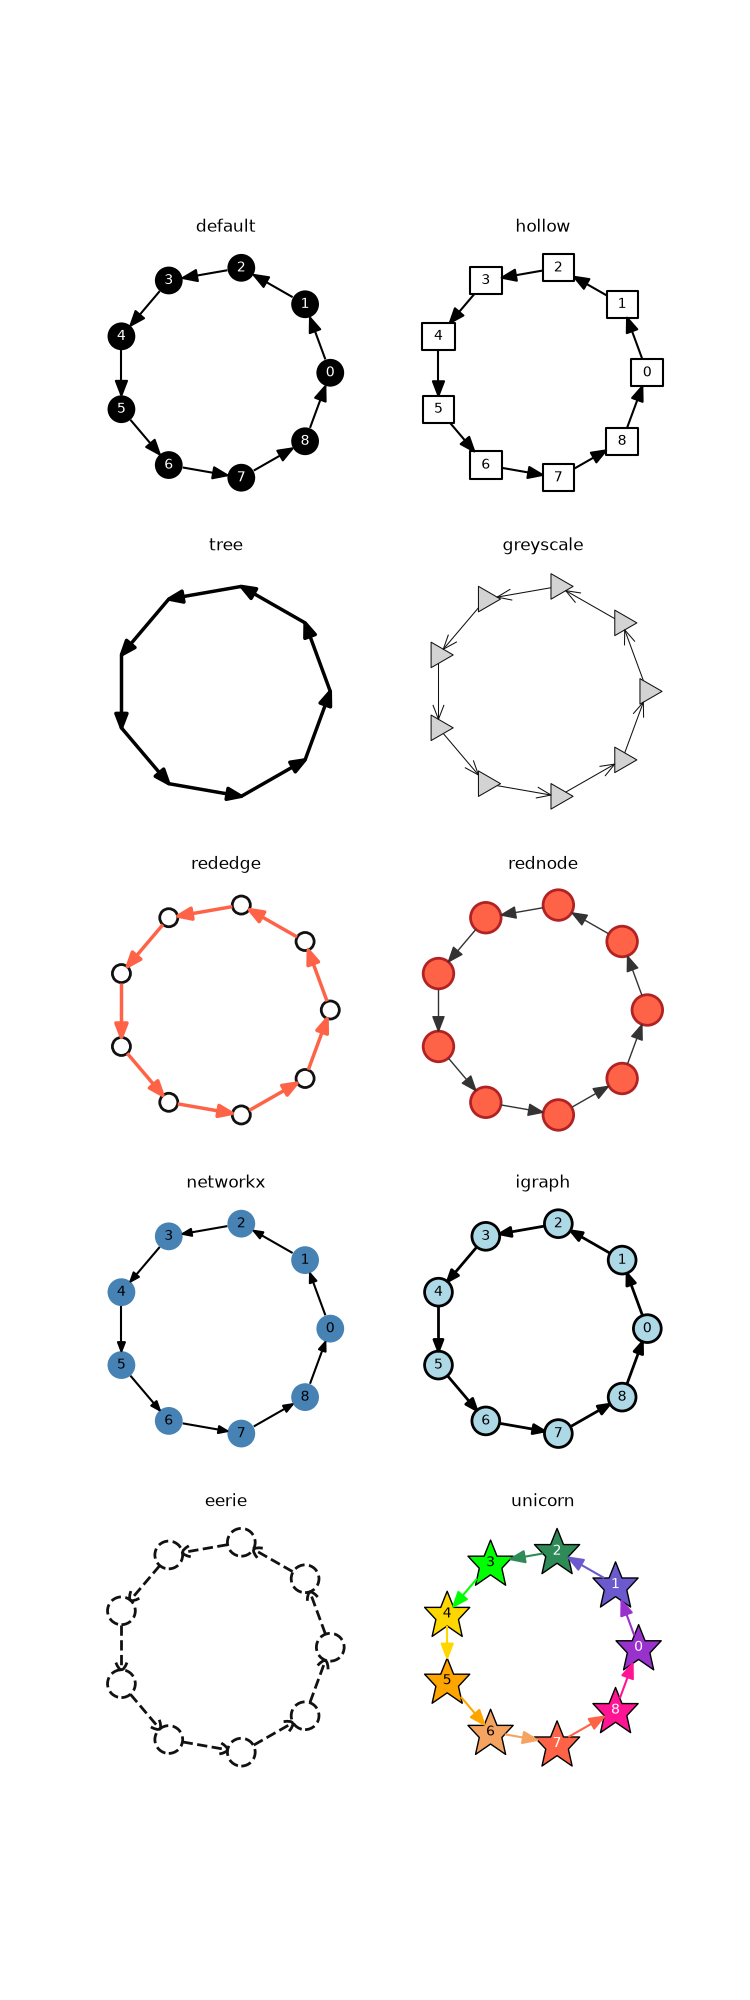
This example shows the same network plotted with a variery of styles from the iplotx style library.
Tip
You can further modify any of these styles with a custom dictionary (see Basics of styling).
import igraph as ig
import matplotlib.pyplot as plt
import iplotx as ipx

styles = [
    "default",
    "hollow",
    "tree",
    "greyscale",
    "rededge",
    "rednode",
    "networkx",
    "igraph",
    "eerie",
    "unicorn",
]

g = ig.Graph.Ring(9, directed=True)
layout = g.layout("circle")

fig, axs = plt.subplots(5, 2, figsize=(7.5, 20))
for style, ax in zip(styles, axs.ravel()):
    ipx.plot(
        g,
        ax=ax,
        layout=layout,
        style=style,
        vertex_labels=style in ("default", "hollow", "unicorn", "networkx", "igraph"),
        title=style,
        margins=0.1 if style == "unicorn" else 0,
    )
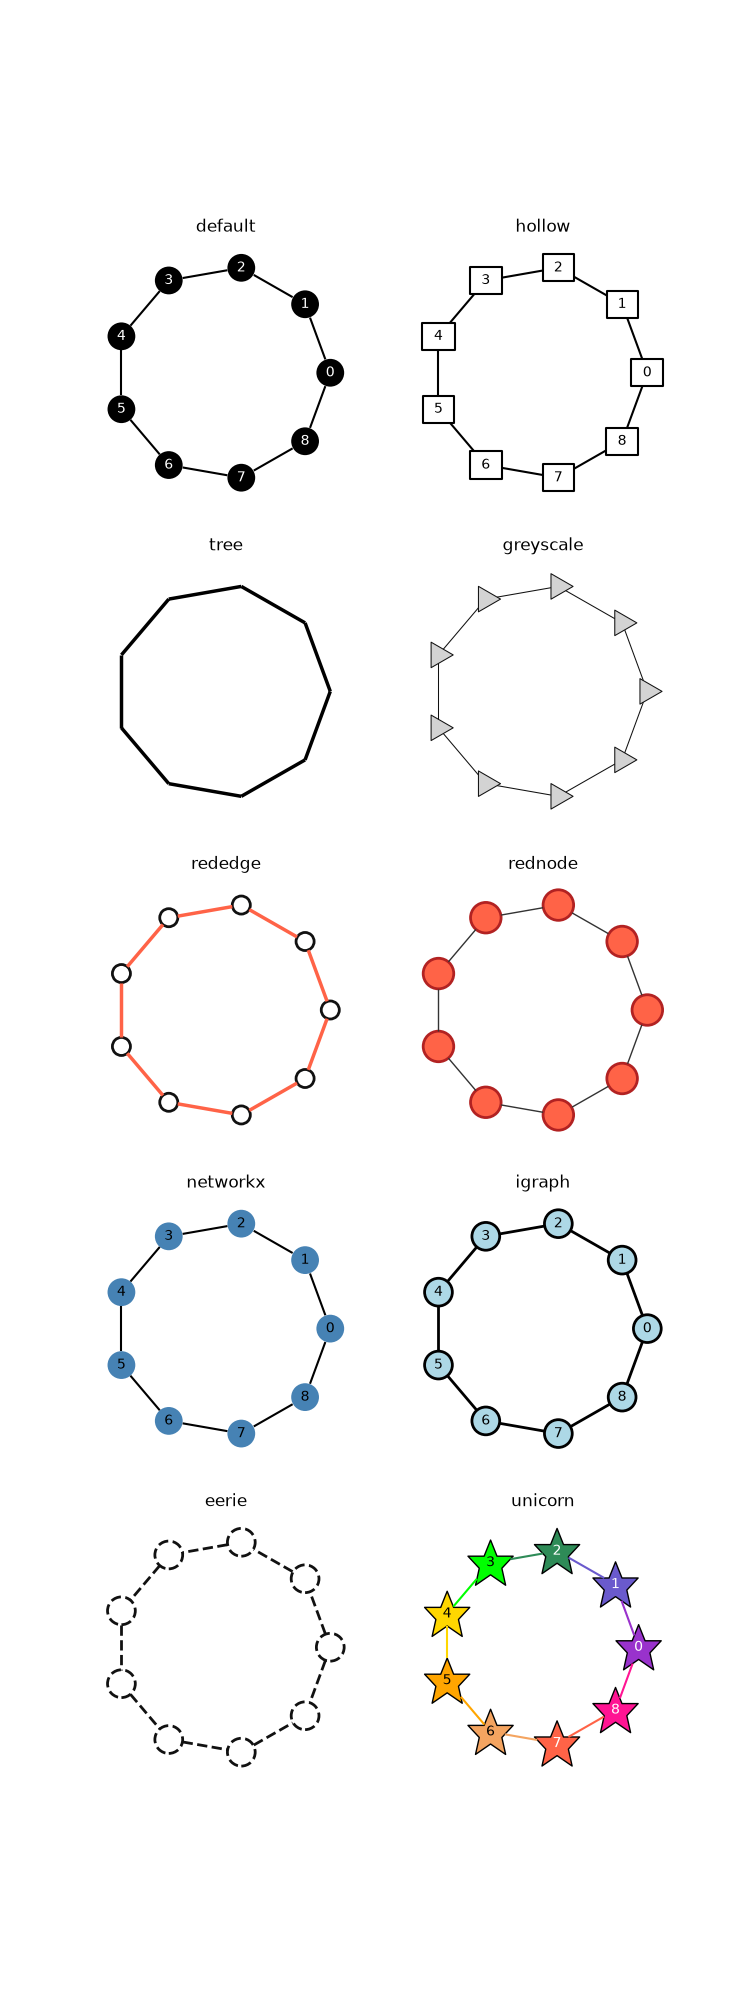
For completeness, below the same plot but for the undirected ring graph:
g = ig.Graph.Ring(9, directed=False)

fig, axs = plt.subplots(5, 2, figsize=(7.5, 20))
for style, ax in zip(styles, axs.ravel()):
    ipx.plot(
        g,
        ax=ax,
        layout="circle",
        style=style,
        vertex_labels=style in ("default", "hollow", "unicorn", "networkx", "igraph"),
        title=style,
        margins=0.1 if style == "unicorn" else 0,
    )
Total running time of the script: (0 minutes 0.673 seconds)